• Members 422 posts
    Oct. 11, 2024, 7:28 p.m.

    We often see Zone V equated to Middle Gray but is rarely mentioned that there are other shades of gray within the Zone.

    I was quite pleased today to find this illustration:

    zones showing no. in the middle.jpg

    It is clear that middle gray (generally agreed to be 18%) is indeed in the middle of Zone V, but I had to know what is the range of reflectance represented by Zone V ?!

    I asked AI:- it said "12% to 24%" but, with AI, it can pay to check - so I figured out how to calculate the range:

    I make the Adams/Archer Zone V range of reflectance to be 12.728% to 25.456%.

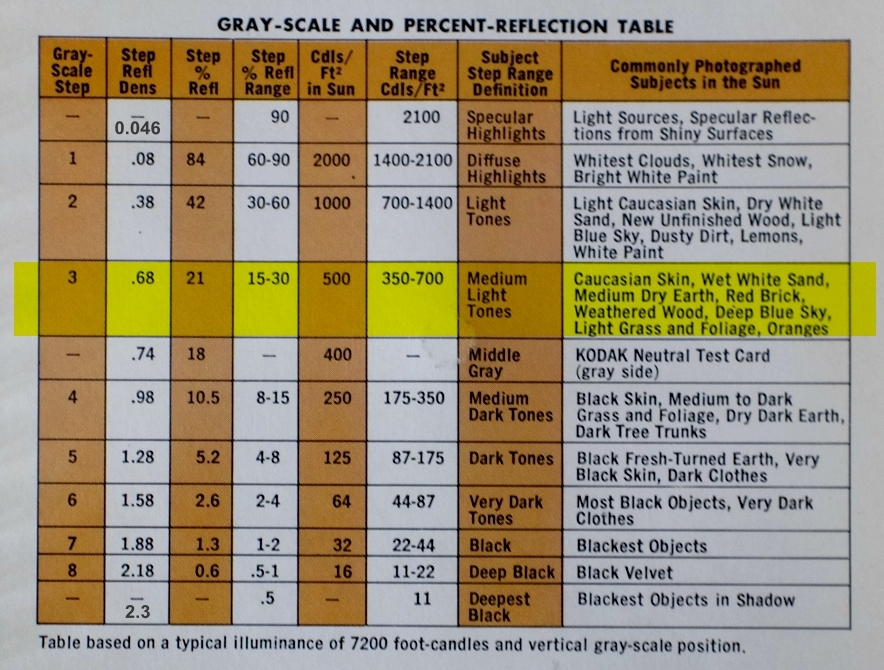
    Interestingly, in the similar and contemporary chart by Kodak, 18% middle gray is not in the middle of the similarly-described range of reflectances e.g. "weathered wood" ... nowhere near, in fact ...

    Anybody know how to go half a stop each side of 18?

    zones showing no. in the middle.jpg

    JPG, 13.6 KB, uploaded by xpatUSA on Oct. 11, 2024.

  • edit

    Thread title has been changed from Adams/Archer Zone V Range FYI.

  • Members 557 posts
    Oct. 12, 2024, 6:54 a.m.

    I'm sure you know this!

    To go one stop above, multiply by 2. To go one stop below, divide by 2.

    To go half a stop above, multiply by the square root of 2. To go half a stop below, divide by the square root of 2.

    So, half-stop intervals around 18 are: 9 .. 12.73 .. 18 .. 25.46 .. 36 .. 50.91 .. 72 .. 101.82

    I think I have probably misunderstood your question - please put me straight!

  • Members 2310 posts
    Oct. 12, 2024, 8:01 a.m.

    isnt middle grey in the middle of black and white, so how can it be 18%

  • Members 557 posts
    Oct. 12, 2024, 10:10 a.m.

    It's a logarithmic scale rather than a linear one.

  • Members 187 posts
    Oct. 12, 2024, 10:57 a.m.

    18% grey is a specific calibrated target.

    A Adams' Zone system is a method of visualisation helping you relate specific brightness in a scene to actual print tones calibrated to, and including variations of, development time. It does this by simplifying the scale to 10 distinct steps and relating those to actual visual reference points people are generally familiar with. These Zones relate directly to the stops on a camera, or each step represents doubling the amount of light (exposure), but only approximately to the actual tones in the finished print or actual densities in the negative which being blue biased presents some variation in response to differing colour temperatures against meter readings.

    Not sure if converting it back into a continuous greyscale with divisions to 3 decimal places that relate only to actual object brightness really understands it's purpose.

  • Members 557 posts
    Oct. 12, 2024, 11:44 a.m.

    I have never used the zone system myself, but I understand that each zone covers one stop.

    If that is the case, then Zone V will be 5 stops below Zone X.
    So Zone V would be from 1.5625% to 3.125% grey.
    Then 18% grey would be roughly in the middle of Zone VIII (12.5% to 25%).

  • Members 187 posts
    Oct. 12, 2024, 1:28 p.m.

    No worries, so please take this response as trying to be informative.

    I use it a lot for B&W sheet film, it's of little use for any other type of photography. It is primarily a system of visualisation that allows you to relate actual meter readings to approximate tones in the finished print factoring in development times. The whole point is to reduce it to ten specific tones so it is easy to visualise. There is no exact mathematical mapping or definition of "exact range of greys" each zone encompasses as it is only a visualisation tool and not a mathematical definition of the greyscale.

    The actual greyscale is final print tone, the actual Zones 1-9 (0 and 10 are hypothetical as they don't relate to a film density you can measure) relate specifically to the stops on the camera. That is a relationship that varies with development time, the mapping of 18% grey to the middle of Zone 5 only occurs with one specifically calibrated deveolpment time.

    The reference point of actual film speed according to the Zone system is the level of exposure that produces the first measurable change in density above film base + fog which is Zone 1. The actual Zones 1-9 as stated also only relate to a specific "standard" development that can only really be calibrated to Zone 1 and Zone 5 (at 18% grey) all others fall where they fall which is not always linear. But generally follow the approximations as in the Zone System, the dynamic range of the film at that development dictates the number of zones, (or camera stops between white and black that it can record). As soon as you vary the development then all bets are off. Standard +1 development time increases the contrast in the film and so reduces it's latitude and so to relate it to actual stops on the camera pure black to pure white becomes Zones 0-9 (or stops 0-9). Decrease development to Standard -1 and then the scale of pure black to pure white as related to stops on the camera becomes Zones 0-11.

    It is a complete waste of time with digital, remember the system specifically relates print tones to actual camera stops and each Zone is +/- one stop. So the Zones 0-10 are a direct result of it being calibrated to film performance, if you want digital then you have to calibrate it to sensor performance. If you take pure white as the saturation point of the sensor then how many stops less exposure = 18% grey? There's no way the 0-10 scale fits digital with any meaning.

    Plus you have absolutely no need to be able to visualise the tones in the finished print because the digital process is not invisible as it is with film. You can see it and look at the histogram in real time with mirrorless.

  • Members 318 posts
    Oct. 12, 2024, 2:03 p.m.

    The thing people often over look is that 18% gray is in the middle between pure black and white because the scale is logarithmic. Adams and Archer developed the Zone system based on the readings of a densitometer - a device that measured the density of the exposed and developed film. That is normal development (N) would map a scene with 10 zones into a negative with 10 zones. Normal plus one (N+1) would map a scene with 9 zones onto a negative with 10 zones, Normal minus one (N-1) would map a scene with 11 zones onto a negative with 10.

    www.greatphotography.com/blog/2016/6/14/18-gray-the-middle-value

  • Members 317 posts
    Oct. 12, 2024, 6:14 p.m.

    I don't think that middle gray is 18%, that's just a somewhat deliberate value that Kodak chose back in 1933(?) for their film based business.
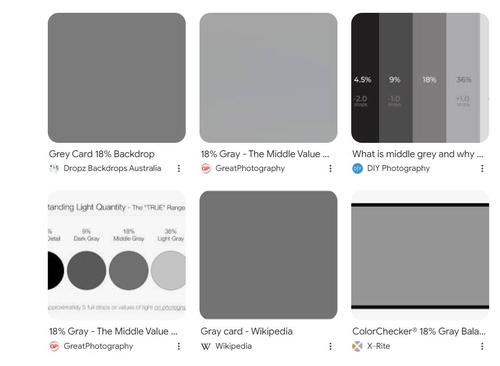
    Different sources locate "middle" gray anywhere in a range from ~12% to beyond 30%, look at the Table of middle grays.
    BTW: Munsell's original N5 (from 1906) is 25.00%.
    NCS S 5000-N (1964) is 26%

  • Members 2310 posts
    Oct. 13, 2024, 8:58 a.m.

    which one is correct
    18.JPG

    18.JPG

    JPG, 57.8 KB, uploaded by DonaldB on Oct. 13, 2024.

  • Members 422 posts
    Oct. 13, 2024, 11:46 p.m.

    After some more research, it looks like Kodak's numbers are based on a span of 0.5% to 90% reflectance:

    photometric.coffeecup.com/exposure/orig%20Kodak%20step%20table%20hilit-1.jpg

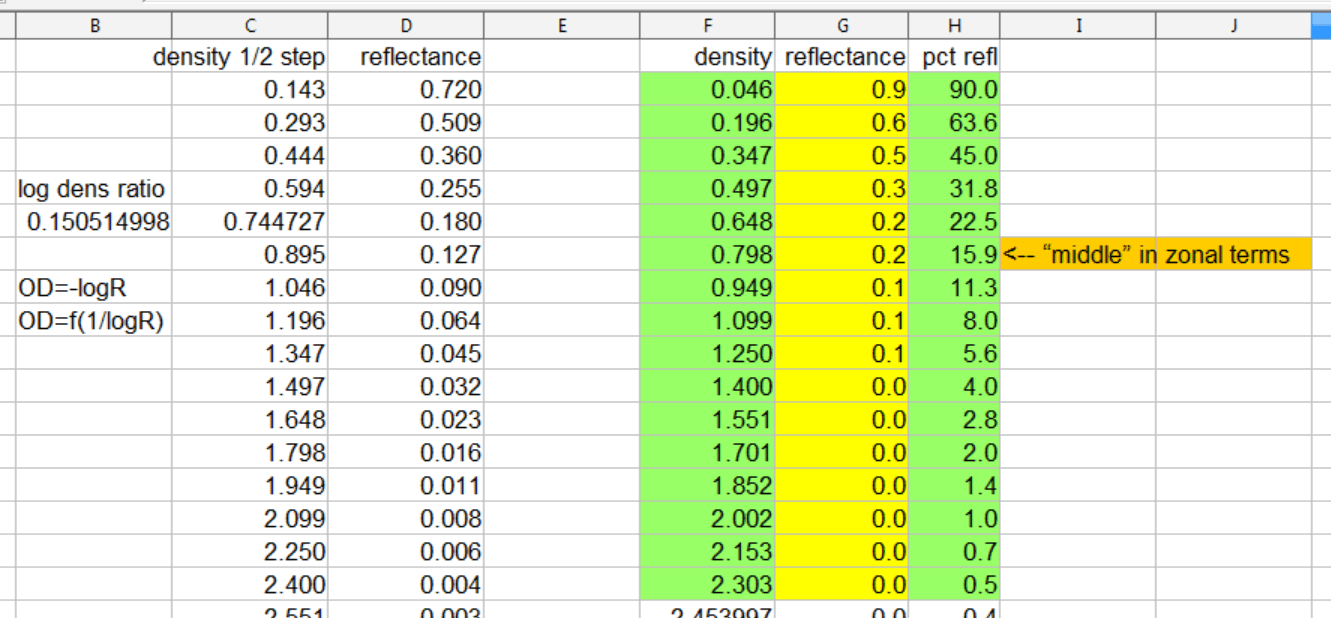
    Based on that, I did a spreadsheet to find the "middle" of Kodak's Step 3 (their equivalent to Zone V):

    photometric.coffeecup.com/exposure/Kodak%20Half-steps.gif

    So not real close to the oft-quoted Adams' 18% - but I do recall reading that Kodak preferred 16% as "mid-gray", so their "15.9%" above comes as no surprise to me ...

  • Members 422 posts
    Oct. 13, 2024, 11:58 p.m.

    Poor terminology on my part. Your examples are correct.

  • Members 422 posts
    Oct. 14, 2024, 12:02 a.m.

    Agreed as to the variability in reflectance associated with "middle gray" but Adams' 18% is by far the most common.

  • Members 422 posts
    Oct. 14, 2024, 12:10 a.m.
  • Members 187 posts
    Oct. 14, 2024, 9:46 a.m.

    And their scale is the other way around.

    I'm still not getting your point here.

    It is a scale that specifically relates subject luminance in one stop increments to the 9 stop DR of B&W film, Each stop represents the change in density on a negative as a result of doubling the exposure from the threshold of film to it's maximum density. The subject field measures the relative reflectance of the print and relates that to real world objects.

    18% grey is a calibrated target, the one that most light meters are calibrated to, or in other words using the ISO/ASA calibration scale and the recommended development times if you point your meter at an 18% grey card and used that for the exposure settings of the camera then you should reproduce 18% grey with some accuracy. It is the calibration target that Adams used and calibrated his light meters to when he collected the data that related actual negative densities against exposure and development times.

    So why are you trying to define the Zone system to a continuous gradient with each zone defined as a range to decimal places? What does that scale relate to?

    It doesn't relate to actual scene luminance because the zones relate to camera stops and real world luminance is not a fixed 9 stop DR.

    It doesn't relate to digital because the digital scale calibrated in zones (where each zone represents the change in density recorded by a one stop increase in exposure of the finished image) doesn't mach the Zones as defined for B&W film.

    It only relates to the greyscale in a B&W film print, and you can then define tone A/EV value A on the finished print as technically being just inside Zone 3?

    Just to add that if you actually need to do this then you really need to expose a B&W film (after determining it's true film speed) to a step wedge where each step is one stop above and the steps are at a point relative to 2 1/2 stops, 3 1/2 stops etc. and measure the densities on the film, and every film/developer combiation will be slightly different... It never was a mathematically defined scale.

    It just seems like maths gone mad for the point of a precise definition when the system is supposed to be an approximation to help visualisation.

  • Members 422 posts
    Oct. 14, 2024, 4:28 p.m.

    @Andrew546

    Simple curiosity from an old invalid who remains interested in the technical aspects of photography.

    In the Kodak Grayscale and %Reflection table, I noticed that - unlike Adams' equivalent - 18% was not in the middle of their equivalent to Zone V.

    At that moment, I was not familiar with many aspects of film negative theory especially anything to do with printing.

    I now know that the scale relates to printing a density range of 3 on paper #2 and have also found that the Kodak table relates to a range of reflectance of 0.5 to 90%.

    I don't need to do anything other than to understand the principles involved and, in any case, what made you think that I own a film camera, rolls of B%W film and a densitometer?

    This is the 'Technical Discussions" category, is it not?

    Feel free to have the coveted Last Word ...

  • Members 422 posts
    Oct. 14, 2024, 5:27 p.m.

    According to ISO/CIPA middle gray is 0.461 of max so, for 8-bit, that is 0.461 x 255 = 118.

    Therefore, none of the above according to my screen color-picker.

  • Oct. 14, 2024, 5:53 p.m.

    You forgot gamma correction? One online tool gives sRGB 0.461 = linear 0.18 (normalized values), thereby for 8-bit 118 equals to 18% of gray :)

    /edit/
    I likely misunderstood your claim. 118 for 8bit and sRGB is correct, but images, from what you pick your colors, are most likely not correctly made.
    What your screen color picker dispalys for next one - should be 117 or 118 (sRGB 118 ≈ Adobe RGB 117):

    gray18.jpg

    gray18.jpg

    JPG, 4.6 KB, uploaded by ArvoJ on Oct. 14, 2024.