Someone recommended a Bruce Fraser white paper that he wrote for Adobe in 2004. It’s still up on the web. I read it. It seemed that it was far from Bruce’s finest work. I read it again, and noticed more things that are wrong with it. I now think that it is not only error-ridden, but that it is conceptually wrong and should be pulled. Some of the errors are being promulgated even today, and so some explication is in order.
In this post, I'm only going to concern myself with the first two errors.
Here's the beginning of the article:
There are two assertions that I’d like to examine. The first is that film and digital respond to light in fundamentally different ways, and the second is that film responds to light like the human visual system (HVS).
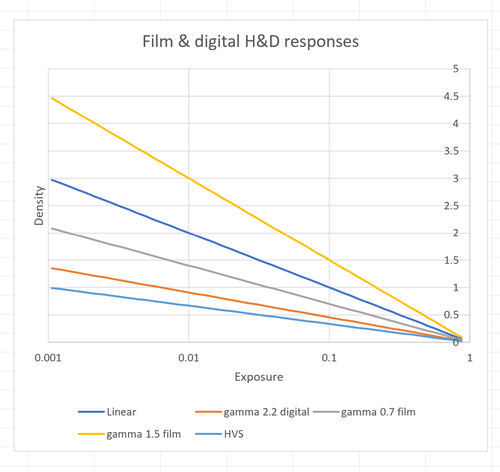
If you’re used to film sensitometry, you’re familiar with the Hurter and Driffeld (aka H&D) curves. They are also known as D log E curves. In these curves, the x-axis is the base 10 logarithm of the exposure, and the y axis is the base 10 logarithm of the absorption of light. That last quantity is also known as density. In the following graph, I’ve plotted a linear response, which is what most digital sensors have. It is possible to develop film so that it is linear through much of its exposure range, and the linear line can serve as a proxy for that. Negative film usually has more of what Bruce calls compression: if you lower the exposure to half of what it was, the density won’t halve, but will go down by less than that. A gamma of 0.7 is not uncommon for developed negative films. Slide, or reversal, film not only doesn’t exhibit compression, it expands the input: if you halve the exposure, the density will more than double. A gamma of 1.5 is typical of slide films developed normally.
Gamma in digital images is specified differently than with film. An image encoded with a gamma of 2.2 will look right on a monitor with a gamma of 2.2. In film sensitometry terms, we’d say that file had a gamma of 0.45. There are several different ways to estimate the nonlinearity of human visual response. For small changes, the lightness axis of CIELab works pretty well. For most of its range, CIE Lstar is the input lightness to the one-third power. In display gamma terms, we’d say it has a gamma of 3.
All of those are plotted on the graph below.
In order to make the different sensor media comparable, I’ve rendered the negative plot above as a positive.
The two film curves are on both sides of the linear one that represents digital capture. Even the flattest film curve is a long way from a gamma 2.2 display, and even further from the human visual system lightness nonlinearity. I see little justification for saying that film capture offers nonlinearities that are far different from digital capture, or for making the claim that film capture nonlinearities are close to those of the human visual system.


