• Members 124 posts
    Aug. 24, 2024, 1:11 a.m.

    ... where "Detail" refers to the texture or sharpness or acutance of stuff in the image.

    These days, when comparing different scenes from different cameras in different lighting, I am beginning to prefer the frequency domain for such work, especially for comparative work.
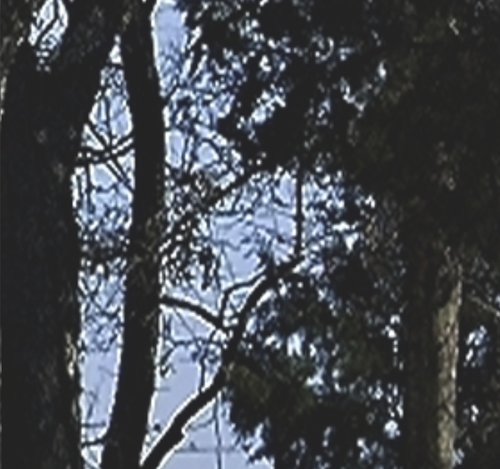
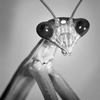
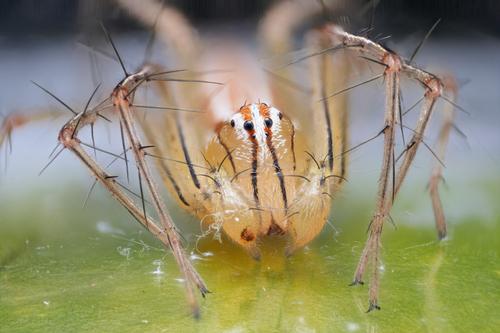
    Take this scene:

    kronometric.org/phot/FFT/texture/orig.jpg

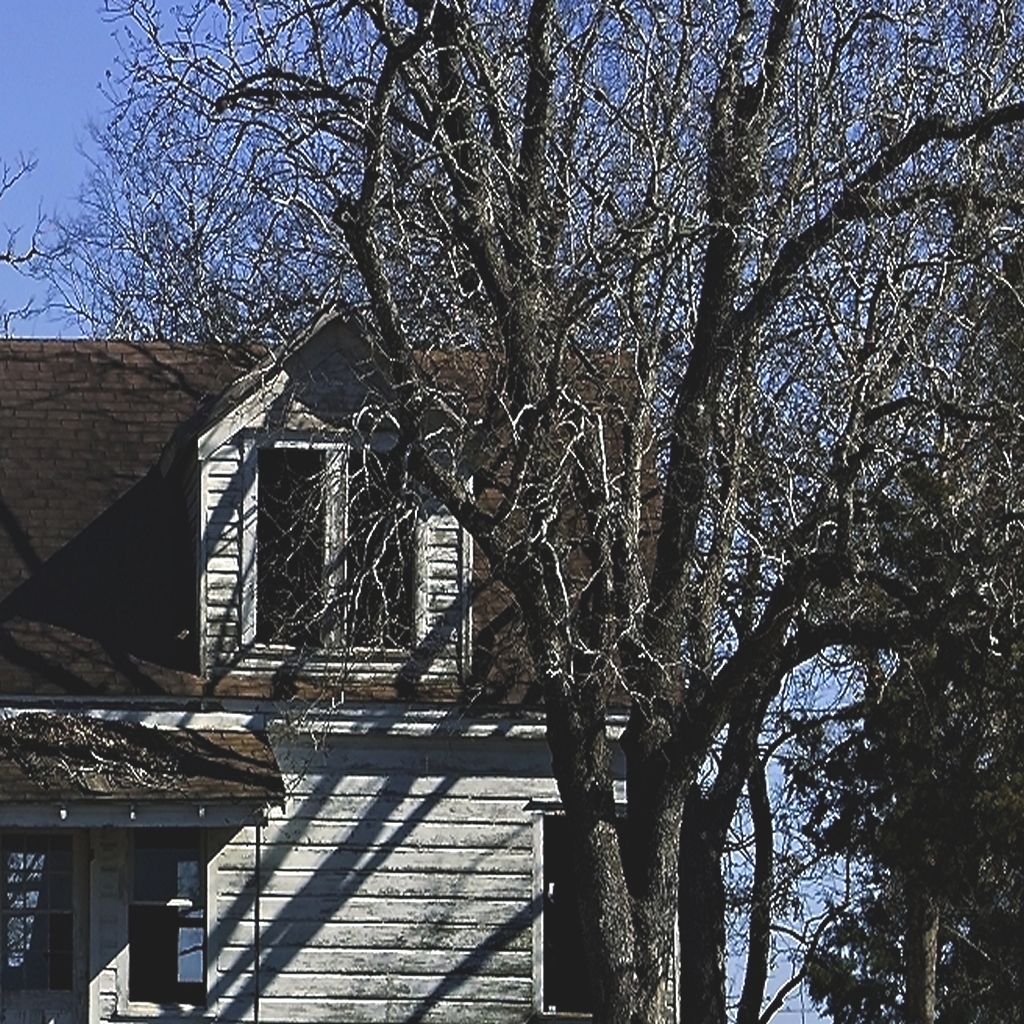
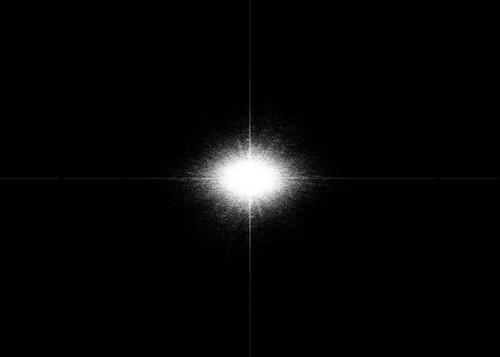
    If I do a Fast Fourier Transform e.g. in the GIMP or ImageJ, I get this plot:

    kronometric.org/phot/FFT/texture/FFT%20orig.jpg

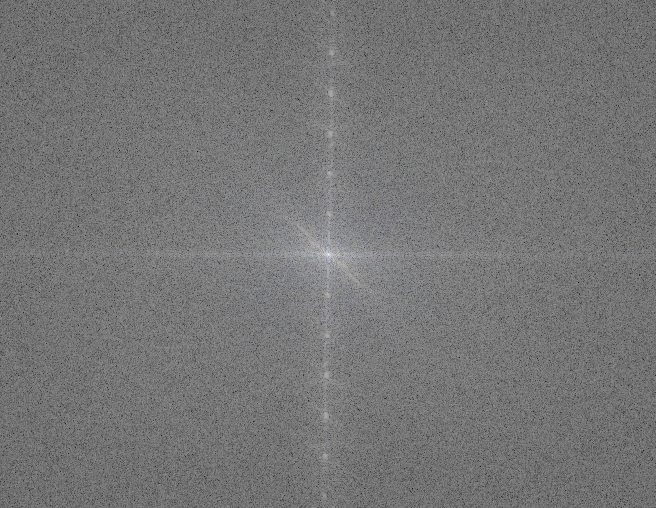
    Each pixel represents a frequency: zero in the middle and Nyquist at the edges. Each pixel's brightness represents the amplitude of the frequency. Typically, pixels around the middle are much brighter than at the edges, as can be seen above. However, comparing this plot to one from a different scene/camera/location, it is hard to see variations - all such plots are much of a muchness, especially for natural scenes.

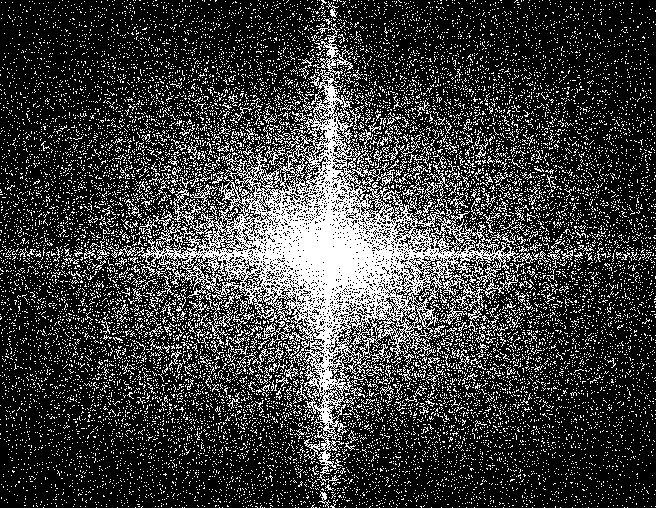
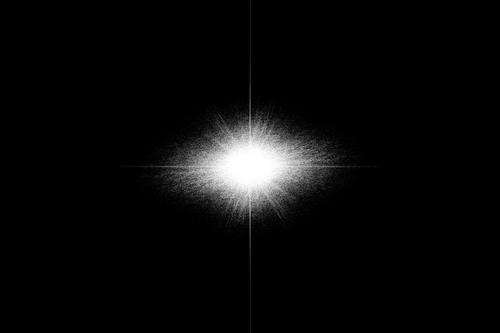
    I discovered that using a threshold function on the plot, set to 0.5 (i.e. 127/255), made the extent of the frequency detail more obvious as higher-frequency but less bright pixels get set to black and anything vice-versa gets set to white, voila:

    kronometric.org/phot/FFT/texture/th%20orig.jpg

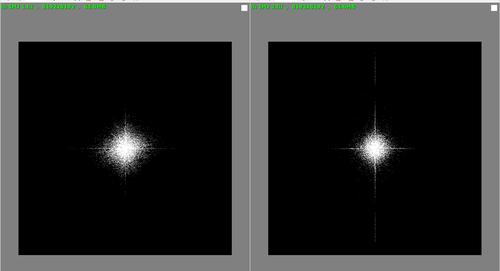
    Then I took the original image, added noise to it, blurred it, and simulated camera-shake separately:

    kronometric.org/phot/FFT/texture/messed%20withs.jpg

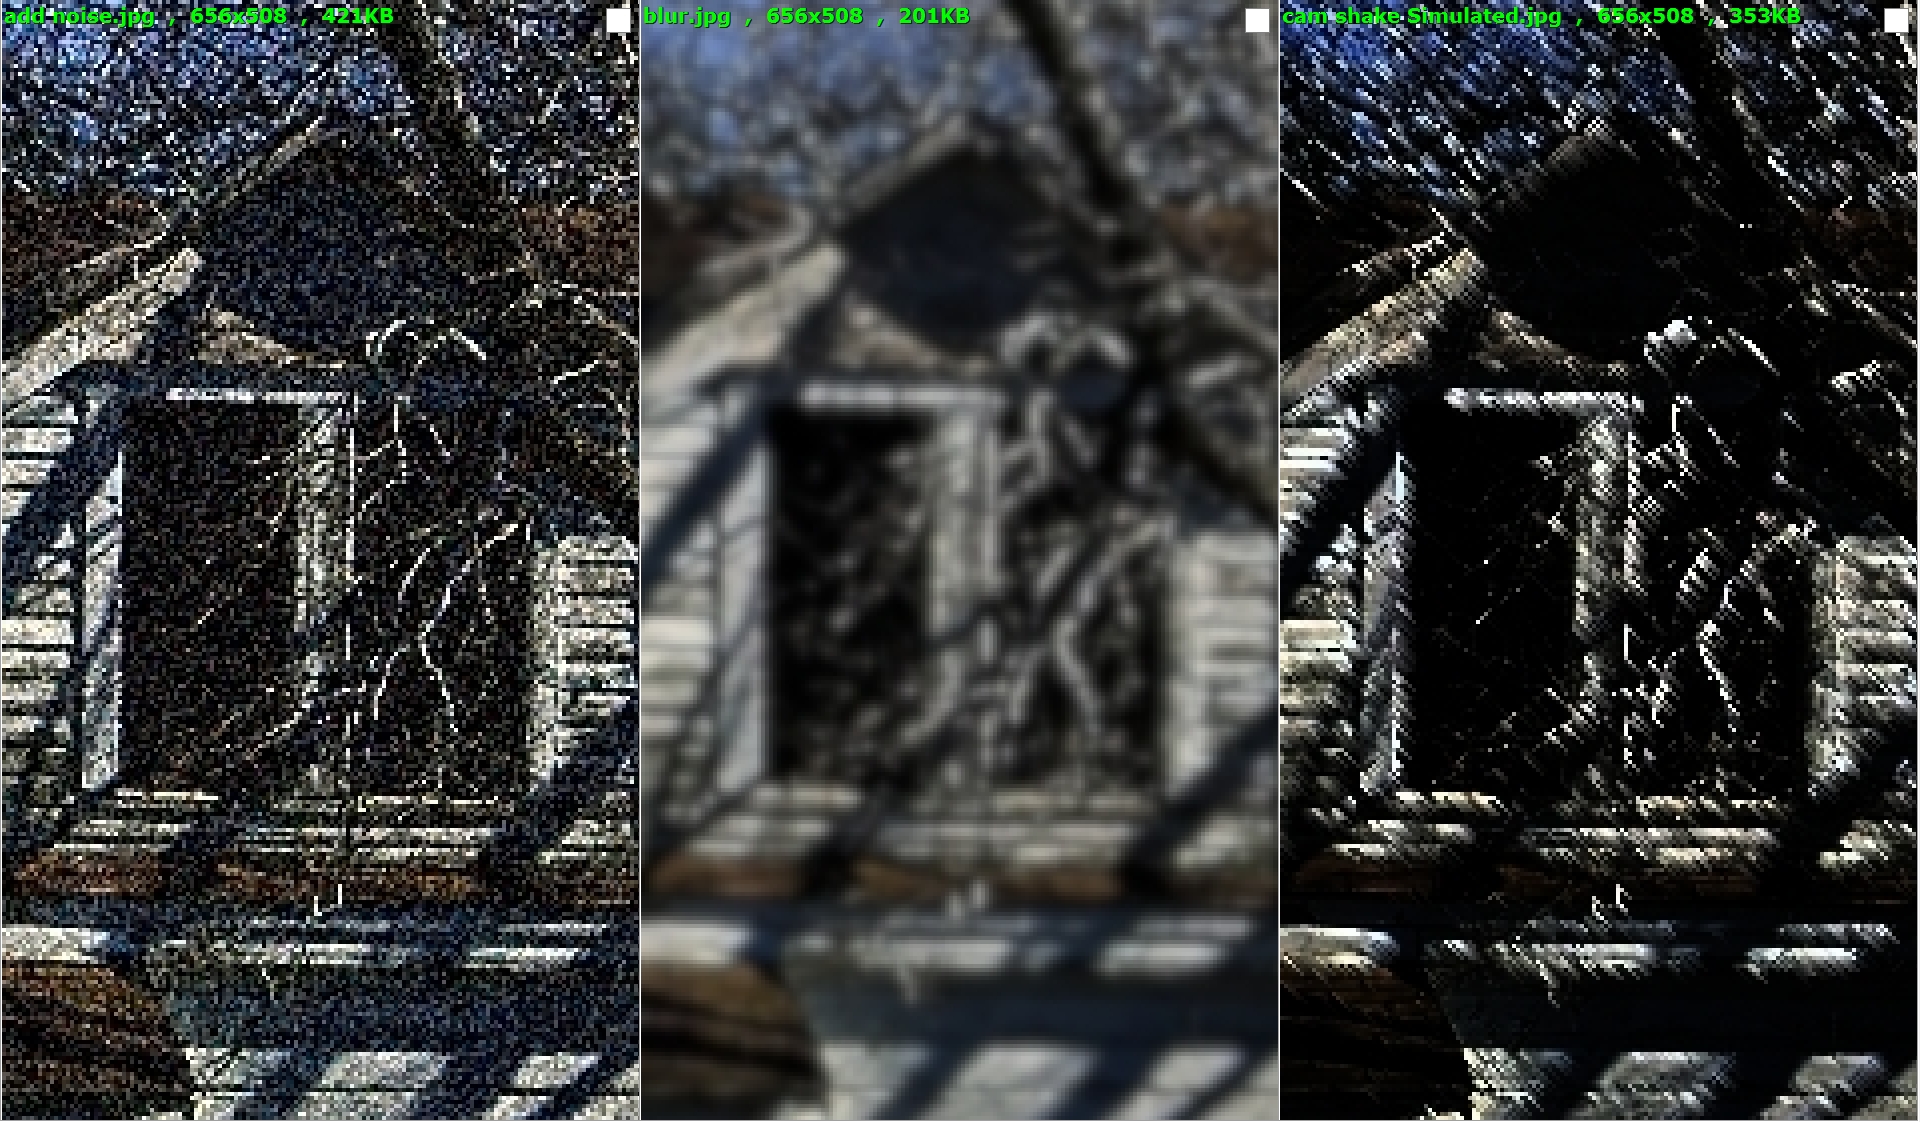
    and here are the threshold plots for those three images:

    kronometric.org/phot/FFT/texture/messed%20with%20tedos.jpg

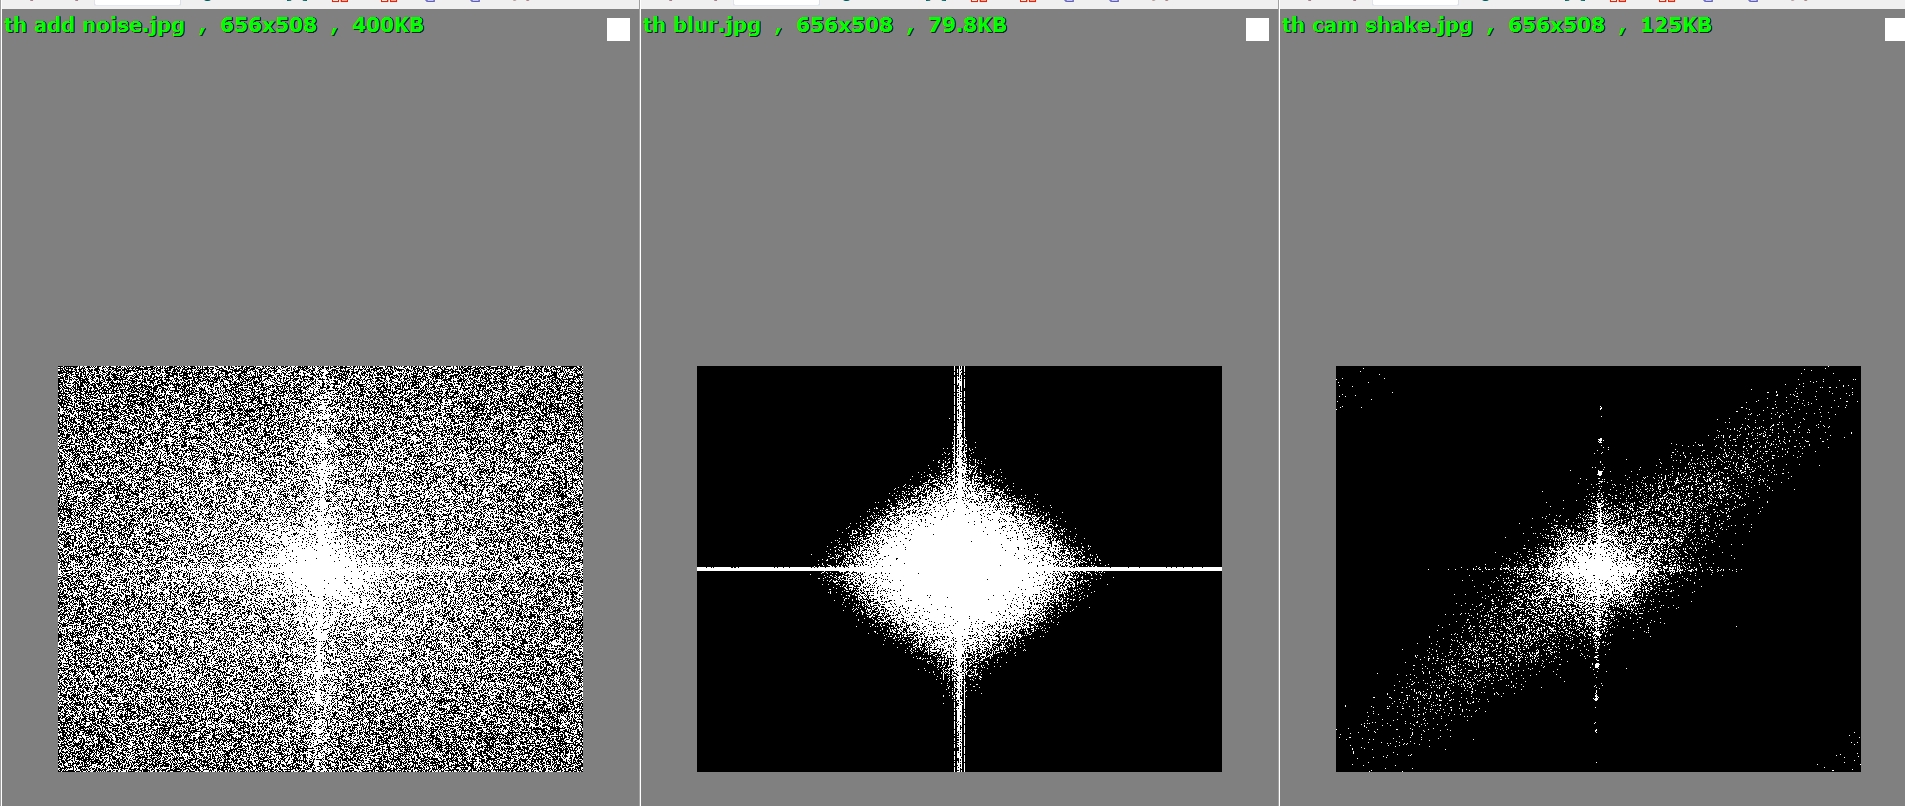
    Notice how the noise added high (toward the edge) frequencies, the blur removed high frequencies, and shake caused frequency patternation at the angle of the shake.

    If there's any interest, I would be happy to analyze a couple or three of member's images the same way but without messing with them ...

  • Members 2284 posts
    Aug. 24, 2024, 5:46 a.m.

    feel free to sharpen and manipulate to your hearts content with your method ,then i will compare your final image to my final processed image to see if i need to up my processing game. this is a 300 image stack straight from zerene stacking program.

    test image for dpr.jpg

    test image for dpr.jpg

    JPG, 16.8 MB, uploaded by DonaldB on Aug. 24, 2024.

  • Members 2284 posts
    Aug. 24, 2024, 7:06 a.m.

    I have a bigger chalenge, so show us how you can retain detail and get rid of the purple fringe at the same time. im pushing the limits of detail,defraction and frequency at 15 x mag. look forward to advancing my knowledge in PP.

    2024-08-20-12.01.32 ZS PMax copy.jpg

    2024-08-20-12.01.32 ZS PMax copy.jpg

    JPG, 14.3 MB, uploaded by DonaldB on Aug. 24, 2024.

  • Members 124 posts
    Aug. 24, 2024, 5:22 p.m.

    I said "I would be happy to analyze a couple or three of member's images the same way but without messing with them ..." meaning without adjusting them, so I decline the challenge.

    Here's the plots from your images as-posted:

    First:
    [th donald 1.jpg]

    Second:
    th donald 2.jpg

    It seems that, using the method as intended, the first image has more frequency detail above 50% than the second.

    The results are elliptical because the posted images are not square and neither do they have to be.

    If I had used ImageJ (Fiji) the plots would have been square.

    th IMJ 1+2.jpg

    The measure of interest either way is how far (%-wise) the frequency pixels are radially from the middle. The further from the middle outward, the finer the detail.

    th IMJ 1+2.jpg

    JPG, 218.3 KB, uploaded by xpatUSA on Aug. 24, 2024.

    th donald 2.jpg

    JPG, 2.1 MB, uploaded by xpatUSA on Aug. 24, 2024.

    th donald 1.jpg

    JPG, 3.1 MB, uploaded by xpatUSA on Aug. 24, 2024.

  • Members 124 posts
    Aug. 24, 2024, 11:40 p.m.

    In the left-hand image, the width in pixels is 6192 so, assuming full-frame, the pixel pitch is about 5.814 um. The edges of the plot represent the Nyquist frequency of 0.5 cycles per pixel, representing 96.451 lp/mm at the sensor, not real high for macro work, eh? 😉

    And the FTT shows the image going only 20% of that for frequencies of more than 50% "power", so only 19.3 lp/mm at the sensor on that basis.

  • Members 2284 posts
    Aug. 25, 2024, 6:53 a.m.

    the fov is 2mm on the second image 100 image stack from the sony a6700 both live subjects,

  • Members 124 posts
    Aug. 25, 2024, 4:16 p.m.

    Yes, that could well explain the lesser detail in the second image. I admire your patience!

  • Members 124 posts
    Sept. 6, 2024, 12:48 p.m.

    It has been pointed out elsewhere that this method produces a scene-dependent result and is only valid if the scenes are identical, e.g. are artificial targets such as "dead leaves", "spilled coins", etc..

    On that basis, I withdraw this Topic, sorry.

  • Members 302 posts
    Sept. 6, 2024, 9:16 p.m.

    Analyzing the spatial frequency is a common technique used in to design reconnaissance imagery systems. It is also a valuable tool for the computer scanning of images to find images of interest for further analysis for such applications as automatic target recognition. It is particularly important in radar imagery but is also applicable in EO imagery. Any sensor can faithfully capture low spatial frequencies - the frequencies near the center of the plot show so normally a "DC" coupling is applied to remove those from the analysis.

    What was shown is noise produces high spatial frequency energy since it is random and independent pixel to pixel. Blurring reduces the high spatial frequency energy since it is a "low pass filter" which removes high frequencies. What we see as "fine detail" is high spatial frequency energy in the image.
    However, there can be some misinterpretation. If on the original FFT plot one looks at the center vertical line one sees evenly spaced strong pixels. These are not unique frequencies but the results of the slats on the house. The multiple stone pixels result from harmonics of the base spatial frequency of the slats - which is actually a pretty low frequency pattern. They disappear as a result of the blurring but are still present with camera shake.

    In reality the spatial frequency analysis is a valuable tool in the design and testing of an imaging system, optical or radar. It is an interesting tool to look at in image analysis. However, there are better tools like the 2D Wavelet transform which is much more useful than the two dimensional Fourier transform.

  • Sept. 6, 2024, 9:32 p.m.

    Do you know some sources, comparing Fourier and Wavelet based deconvolution algorithms? (If there exists deconvolution in wavelet world of course.)
    I kinda understand Fourier side of things, wavelets are a bit of mystery to me :)

  • Sept. 7, 2024, 7:46 p.m.

    I don't understand a word of what Truman posted. What does it really mean for us (in words that a simple person like me can understand)?

    Alan

  • Sept. 7, 2024, 8:42 p.m.

    Well, we need to start from beginning [of the thread].

    Ted presented here some frequency analysis plots (FFT) of different images, showing that more detail is correlated to bigger amount of high frequencies. (On such a diagrams zero frequency is in the centre.) [Spatial] frequency on image means, how fast intensity varies between neighbouring areas.
    You don't need to learn math to understand this, I hope :)

    (Mathematically every kind of changing value of something can be seprarated into single frequencies - like you take some piece of audio signal and can extract all contained frequencies from that - same for image, just result is two-dimensional.)

    Truman stated that such fequency analysis is commonly used in computerised imaging systems; I would add that it is used to detect presence of and classify (not so visible) objects or artefacts - and to indirectly suppress noise.
    Then Truman comments on particular diagrams from Teds posting, including how blurring decreases high frequency content and how repeated image elements create multiple frequency bands (harmonics).
    Then Truman tells that FFT analysis (Fast Fourier Transform) is not universally ideal tool and for many applications wawelet analysis gives much better results.

    And then I asked for some technical information :)

    Was that any better? For normal user this all is of no importance anyway :)

  • Members 105 posts
    Sept. 7, 2024, 9:47 p.m.

    Personally, I found the image in the OP to be over sharpened, and so all else had no meaning as it was just measuring the boosted acutance of an over processed image (zoom below). In my day we used to look at the actual photos to decide which was best, not an abstracted numerical translation. Just sayin'.

    Screenshot 2024-09-07 at 22.35.36.png

    Screenshot 2024-09-07 at 22.35.36.png

    PNG, 5.2 MB, uploaded by Andrew546 on Sept. 7, 2024.

  • Members 302 posts
    Sept. 7, 2024, 9:56 p.m.

    The Fourier transform is the common tool for harmonic analysis. It is the tool to use for describing and analyzing harmonic oscillations that result from physical phenomena. Periodic functions can be described by a Fourier series - a sum of sin and cos functions.

    In imagery, the basis measure is based on line pairs per mm, which are square waves - not sin waves. This is why the harmonics in the vertical based on the siding slats.

    www.leap.ee.iisc.ac.in/sriram/teaching/MLSP_16/refs/W24-Wavelets.pdf

    In imaging radar, the Fourier transform is much more applicable than it is in optical imagery where wavelets provide a tool.

    hbil.bme.columbia.edu/files/publications/Wavelets%20in%20Medical%20Image%20Processing-%20Denoising%2C%20Segmentation%2C%20and%20Registration%2522%2C%20Handbook%20of%20Medical%20Image%20Analysis-%20Advanced%20Segmentation%20and%20Registration%20Models.pdf

    www.youtube.com/watch?v=pUty-98Km_0

    However, it all gets down to the fact that the more detail, the higher the spatial frequency.

  • Sept. 7, 2024, 10:30 p.m.

    Thank you - that does make more sense now. I guess I needed to know WHY you do it.

    Alan

  • Members 124 posts
    Sept. 8, 2024, 12:23 a.m.

    The statement is misleading. There can sine waves, cosine waves, triangular waves, sawtooth waves and no doubt many other types of wave.

  • Members 276 posts
    Sept. 8, 2024, 6:07 a.m.

    Just for the records:

    • An ideal square wave is composed of the sum of an infinite number of odd-integer harmonic sinusoidal waveforms.

    • Cosine waves are different than sine waves in that the cosine wave is a quarter cycle before the sine wave. If one were to shift the cosine wave by ½π to the right, it is identical in every respect to the sine wave.

    • Other types of waves can be can be created by adding sufficient number of sine waves. This process is referred to as "Additive synthesis".

    e.g. www.perfectcircuit.com/signal/difference-between-waveforms

  • Members 124 posts
    Sept. 8, 2024, 5:53 p.m.

    Thanks for link. Off-topic, but "Waveform oscillations can move at different speeds, or frequencies. The faster they move, the higher frequency they have." seems to be worded for the punters ... In my world, all oscillations move at the same speed, irrespective of their frequency ... ignoring Einstein and Doppler, LOL.