... where "Detail" refers to the texture or sharpness or acutance of stuff in the image.
These days, when comparing different scenes from different cameras in different lighting, I am beginning to prefer the frequency domain for such work, especially for comparative work.
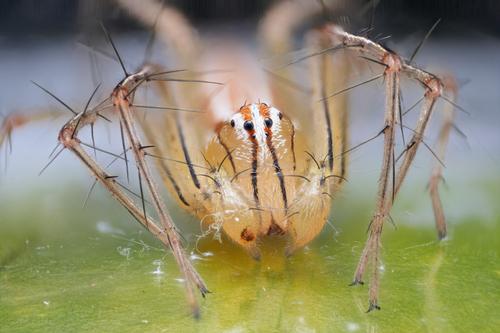
Take this scene:
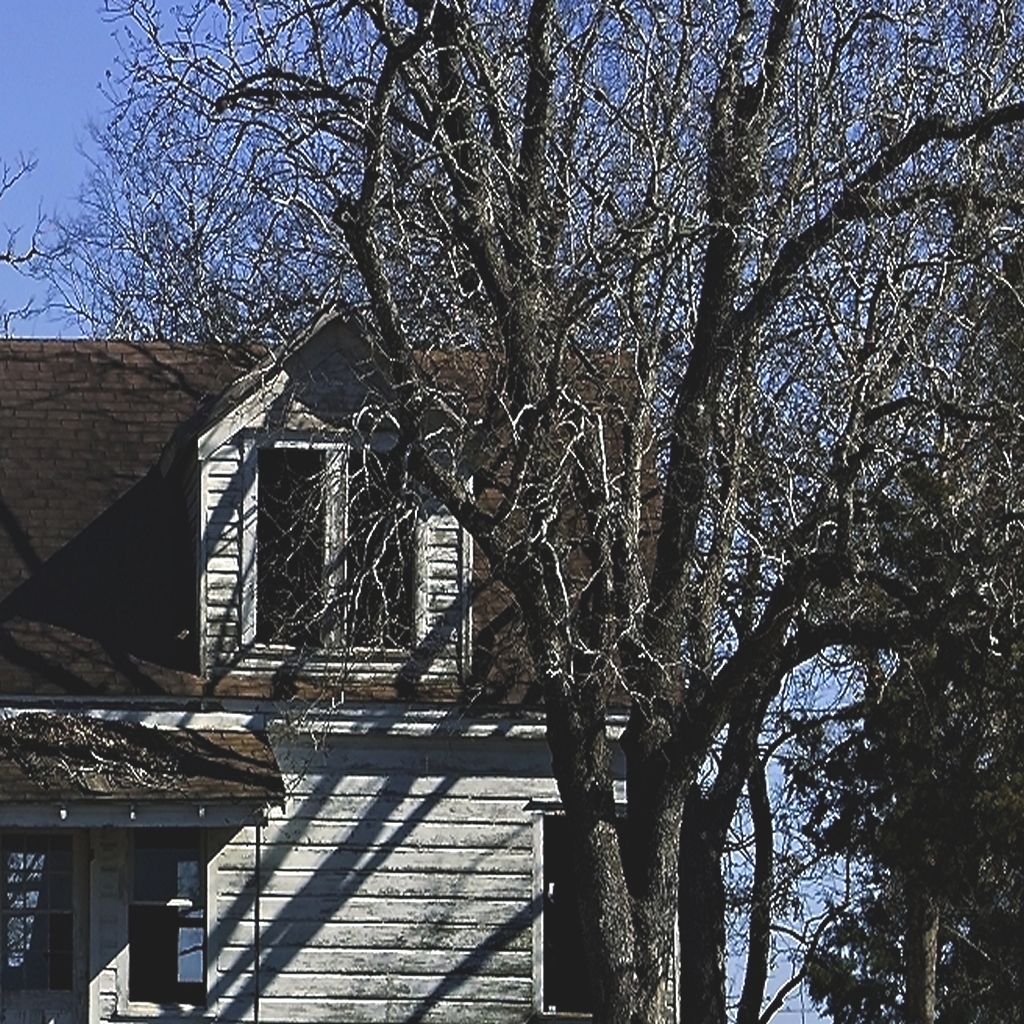
If I do a Fast Fourier Transform e.g. in the GIMP or ImageJ, I get this plot:
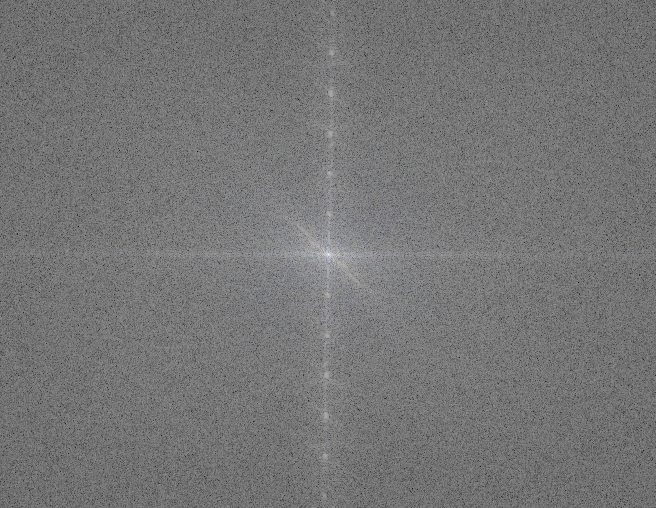
Each pixel represents a frequency: zero in the middle and Nyquist at the edges. Each pixel's brightness represents the amplitude of the frequency. Typically, pixels around the middle are much brighter than at the edges, as can be seen above. However, comparing this plot to one from a different scene/camera/location, it is hard to see variations - all such plots are much of a muchness, especially for natural scenes.
I discovered that using a threshold function on the plot, set to 0.5 (i.e. 127/255), made the extent of the frequency detail more obvious as higher-frequency but less bright pixels get set to black and anything vice-versa gets set to white, voila:
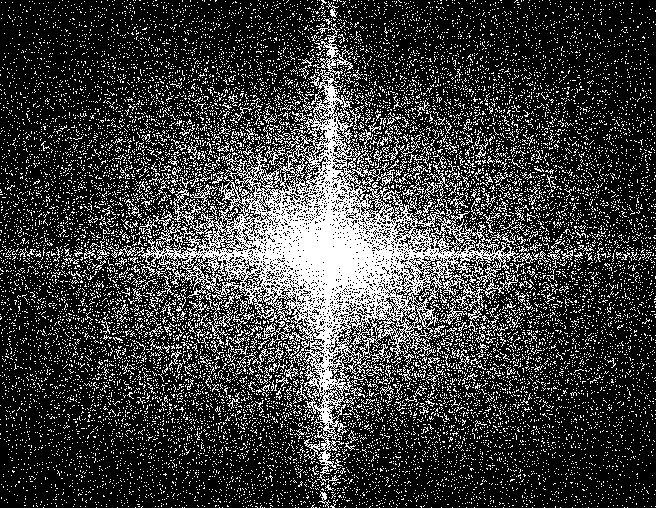
Then I took the original image, added noise to it, blurred it, and simulated camera-shake separately:
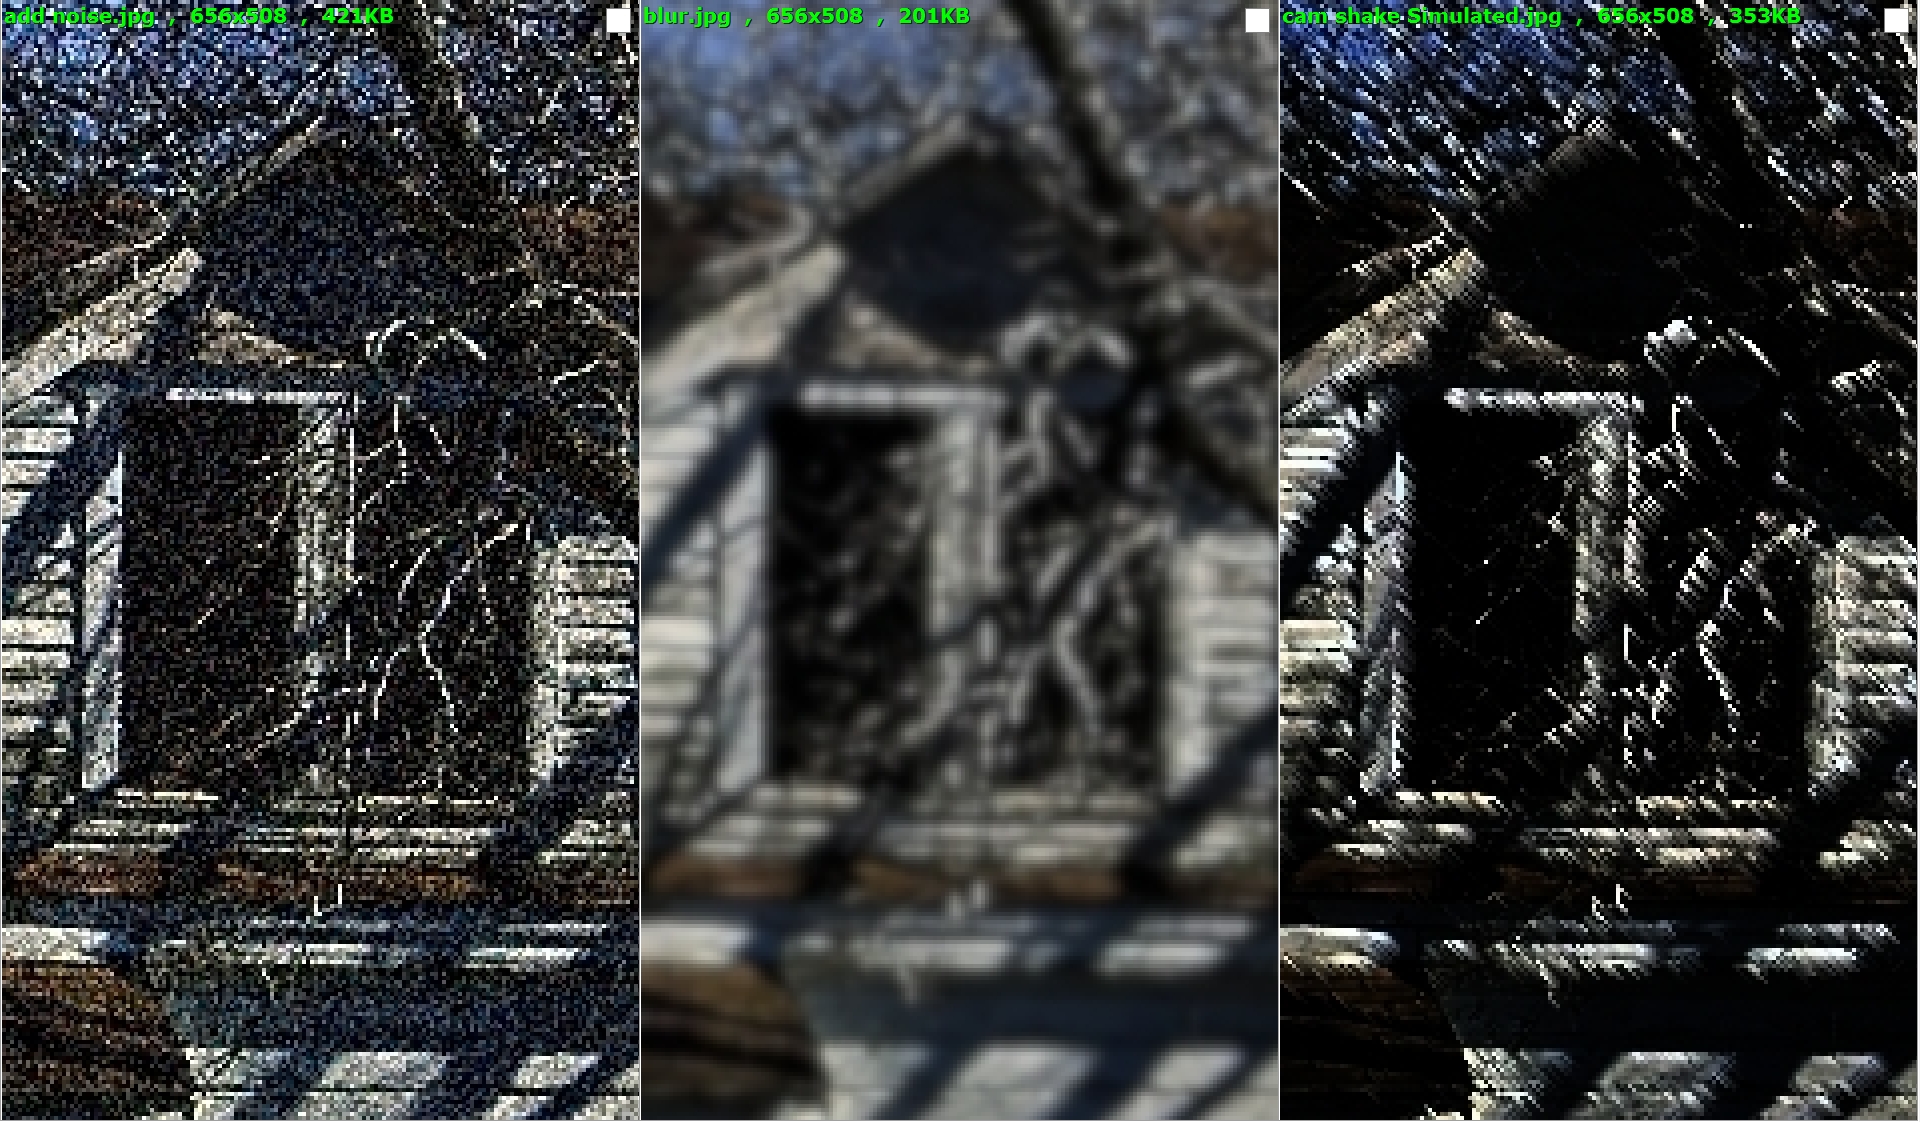
and here are the threshold plots for those three images:
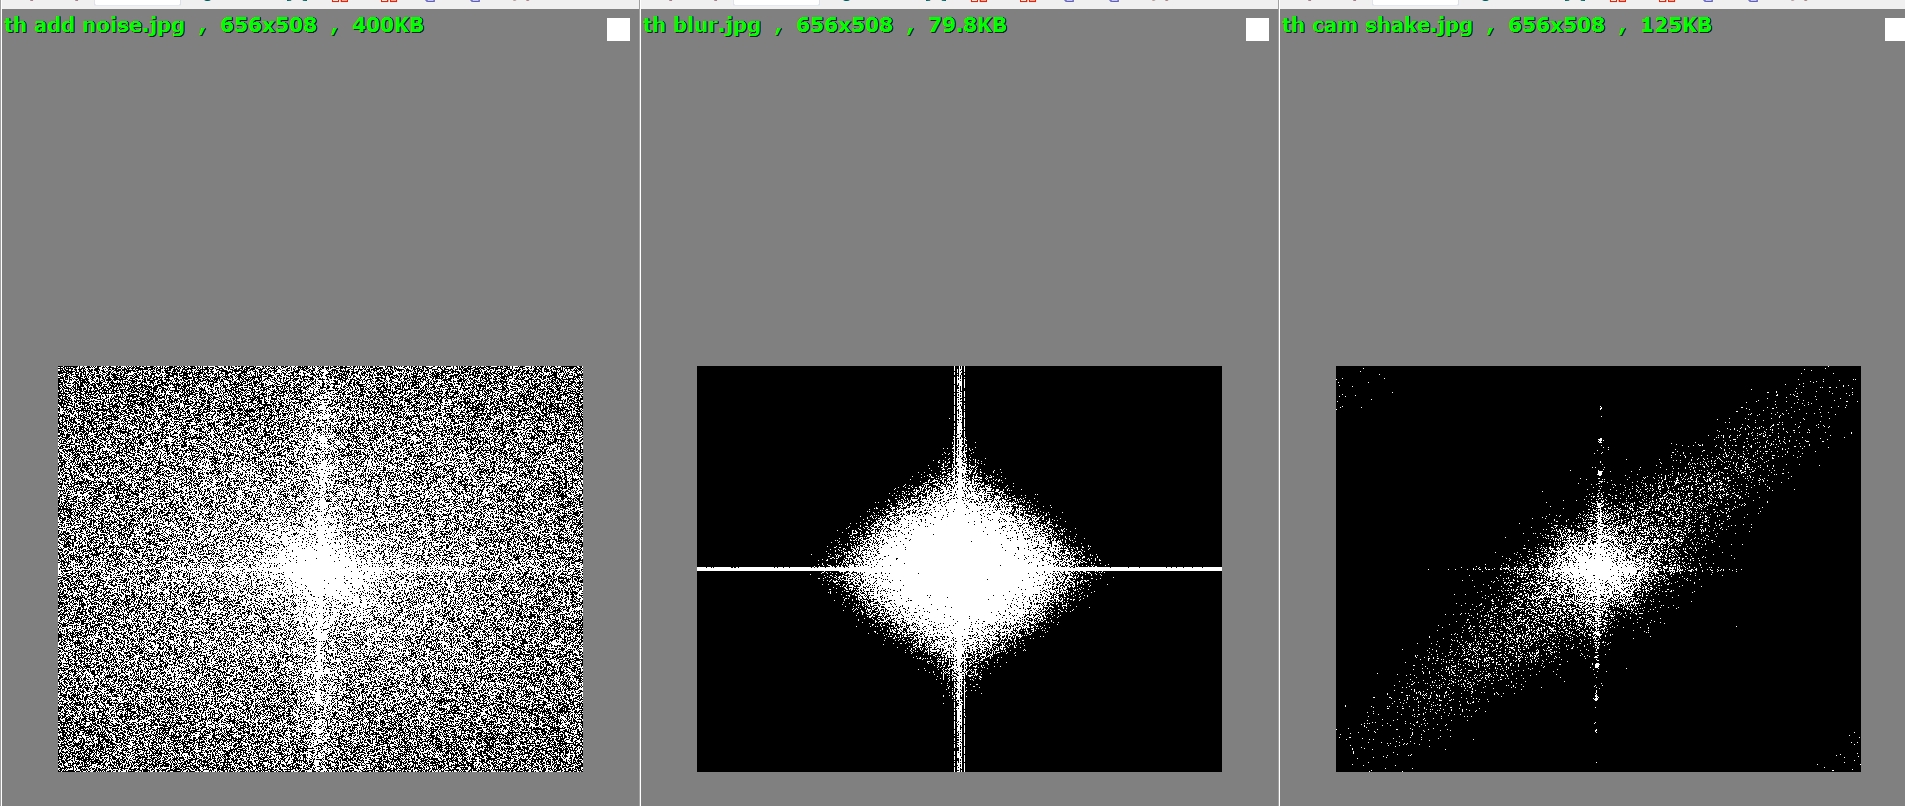
Notice how the noise added high (toward the edge) frequencies, the blur removed high frequencies, and shake caused frequency patternation at the angle of the shake.
If there's any interest, I would be happy to analyze a couple or three of member's images the same way but without messing with them ...

 ]
]

