• DeletedRemoved user
    a year ago

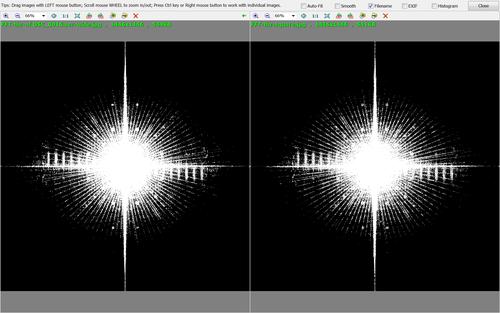
    I ask because a G'MIC FFT transform plot has the same aspect ratio as the input image ... but ImageJ (Fiji) produces a square plot and not necessarily the same edge size as either of the input edges - instead seeming to pick an edge dimension from a series like 1024, 2048, 4096, etc.

    I know that the plot is based on Nyquist going from the center to an edge and I'm guessing that the square ImageJ plot should not affect one's assessment of the plot in terms of frequency response.

    Anybody?

  • JACShelp_outline
    878 posts
    a year ago

    [deleted]

  • finnanhelp_outline
    322 posts
    a year ago

    HAND.

  • DeletedRemoved user
    a year ago

    Thanks for the link. I don't know how to do padding - I just click on the FFT ImageJ sub-menu item at it's default settings.

    Unfortunately I don't have or use Matlab ... too technical for this old man ...

    I do have Image Magick - it probably can FFT.

  • DeletedRemoved user
    a year ago

    Hmmm ...

  • DeletedRemoved user
    a year ago

    There, it says:

    To make it work as people generally expect for images, any non-square image or one with an odd dimension will be padded (using Virtual Pixels to be square of the maximum width or height of the image. To allow for proper centering of the 'FFT origin' in the center of the image, it is also forced to have an even (multiple of 2) dimensions. The consequence of this is that after applying the Inverse Fourier Transform, the image will need to be cropped back to its original dimensions to remove the padding.

    Sounds much like what ImageJ does ... not sure I like it because I don't know how padding works for FFT magnitude plots, grump.

  • JACShelp_outline
    878 posts
    a year ago

    [deleted]

  • DeletedRemoved user
    a year ago

    Are they talking about padding the original image before transformation, d'you think? And what are "Virtual Pixels", I wonder?

    Then, for a square plot having even dimensions, does not the center fall between two pixels?!

  • JACShelp_outline
    878 posts
    a year ago

    [deleted]

  • DeletedRemoved user
    a year ago

    looks like no padding, according to their 128x128 white square example:

    eg.jpg

    A bit above my head, sorry.

    I was thinking that an FFT plot of say 256x256 px can not have a 'DC' pixel at the exact center of the image, whereas a 255x255 px plot can.

    eg.jpg

    JPG, 300.2 KB, uploaded by xpatUSA a year ago.

  • ArvoJlens
    a year ago

    Can you run similar script with 200x300 white image? If they pad it, then they have to pad it with white pixels, otherwise result will not be single dot.

  • DeletedRemoved user
    a year ago

    I'll try, may take a while ... my example was a screen print from their FFT Tutorial. I'm not so hot with command-line stuff.

  • DeletedRemoved user
    a year ago

    Nope, sorry - my version of ImageMagick gives errors when I type in that command line, perhaps finger trouble on my part, grump.

  • DeletedRemoved user
    a year ago

    Not finger trouble, apparently I am missing "the FFTW delegate library that is the core of the FFT code". I don't think I'll bother any further with IM's FFT.

    My use of FFT is to assess image texture/detail by creating a magnitude plot (already 'log' with DC centered), then using a threshold function to eliminate low power frequencies for easier assessment.

    In that regard, I believe that the plot Aspect Ratio doesn't matter and neither does padding as far as I can tell.

    Thanks all for your help!

  • DeletedRemoved user
    a year ago

    To test that belief, I produced FFT plots of a wide Aspect Ratio image with G'MIC and ImageJ. I resampled the G'MIC plot to be square. I resized the ImageJ plot to the same size as the G'MIC, Then applied the GIMP Threshold function to each plot. It takes an eagle's eye to spot any differences:

    compFFTs.jpg

    It would seem that padding and Aspect Ratio make no difference for my purpose!

    compFFTs.jpg

    JPG, 655.9 KB, uploaded by xpatUSA a year ago.

  • ArvoJlens
    a year ago

    Interesting result, I mean strong frequency bands and overall structure. Can you show us source image?

  • JACShelp_outline
    878 posts
    a year ago

    [deleted]

  • DeletedRemoved user
    a year ago

    It's 8 MB and you will both recognize it:

    DSC_0016.acr-wide.jpg

    Alternative plots would certainly be of interest, thanks in advance!

    DSC_0016.acr-wide.jpg

    JPG, 8.0 MB, uploaded by xpatUSA a year ago.

  • JACShelp_outline
    878 posts
    a year ago

    [deleted]

  • ArvoJlens
    a year ago

    I suspected some geometrical image :)
    Radial structure source seems clear (stars), but those vertical stripes - why they are not level? Effect from those wedge-shaped bw areas?

    I've used some DFT/inverse DFT plugin only on badly acquired video with unfiltered PAL color signal, there were no such geometrical artefacts on DFT plot there.

  • DeletedRemoved user
    a year ago

    Thanks ... here's the G'MIC version:

    FFT-wide.jpg

    FFT-wide.jpg

    JPG, 1.4 MB, uploaded by xpatUSA a year ago.

  • JACShelp_outline
    878 posts
    a year ago

    [deleted]