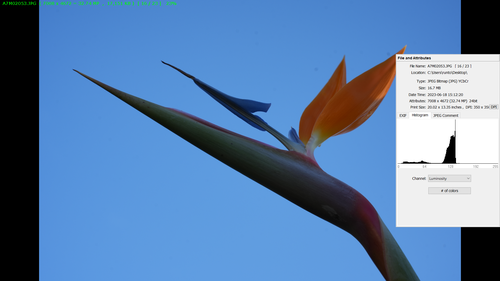
it was just a good article about luminance. and does contradict many members writings here.
-
-
-
@DonaldB has written:@xpatUSA has written:@DonaldB has written:
Quote: A histogram is simply a graphic representation of the exposure levels within an image.
Just levels, Donald, not "exposure levels".
the article i read said exposure levels.
Which article?
Which histogram?
What is exposure level? -
@DonaldB has written:
it was just a good article about luminance. and does contradict many members writings here.
Not sure what you're talking about. Be explicit about the contradictions that you see. List them.
-
@IliahBorg has written:@DonaldB has written:@xpatUSA has written:@DonaldB has written:
Quote: A histogram is simply a graphic representation of the exposure levels within an image.
Just levels, Donald, not "exposure levels".
the article i read said exposure levels.
Which article?
Which histogram?
What is exposure level? -
@xpatUSA has written:@DonaldB has written:@xpatUSA has written:@DonaldB has written:
Quote: A histogram is simply a graphic representation of the exposure levels within an image.
Just levels, Donald, not "exposure levels".
the article i read said exposure levels.
This one? (not a trap)
no but it says the same as this one.
-
@DonaldB has written:@IliahBorg has written:@DonaldB has written:@xpatUSA has written:@DonaldB has written:
Quote: A histogram is simply a graphic representation of the exposure levels within an image.
Just levels, Donald, not "exposure levels".
the article i read said exposure levels.
Which article?
Which histogram?
What is exposure level?I don't find "Exposure levels" there.
-
@DonaldB has written:@xpatUSA has written:@DonaldB has written:@xpatUSA has written:@DonaldB has written:
Quote: A histogram is simply a graphic representation of the exposure levels within an image.
Just levels, Donald, not "exposure levels".
the article i read said exposure levels.
This one? (not a trap)
no but it says the same as this one.
Word for word, interesting, thanks.
-
@TimoK has written:@DonaldB has written:@IliahBorg has written:@DonaldB has written:@xpatUSA has written:@DonaldB has written:
Quote: A histogram is simply a graphic representation of the exposure levels within an image.
Just levels, Donald, not "exposure levels".
the article i read said exposure levels.
Which article?
Which histogram?
What is exposure level?I don't find "Exposure levels" there.
keep reading
-
@xpatUSA has written:@DonaldB has written:@xpatUSA has written:@DonaldB has written:@xpatUSA has written:@DonaldB has written:
Quote: A histogram is simply a graphic representation of the exposure levels within an image.
Just levels, Donald, not "exposure levels".
the article i read said exposure levels.
This one? (not a trap)
no but it says the same as this one.
Word for word, interesting, thanks.
I like the wording.
Identical exposure settings shutter+apeture+iso
-
@DonaldB has written:
conclusion: exposure = shutter, t stop, and scene luminance which is displayed by the histogram now we have practical picture (pun) to work off.
what does these histogram tell you about the exposure

Notice how the patches show differently in the 2 histogram even when they represent the same lab values.
How those values are shown in a histogram vary depending on what that distribution of data represents in a color space.
(both are of jpg images and not raw) -
@DonaldB has written:
Identical exposure settings shutter+apeture+iso
So what? I don't see the point you are trying to make.
When using flash you have 2 exposures* to deal with - the ambient exposure* and the flash exposure*
The flash exposure* can be set automatically by the camera using ETTL or manually.
Even though the aperture, shutter speed and ISO are the same in both shots the total exposure* for Screenshot(5) was larger because more light from the scene hit the sensor due to the additional light added to the scene by the flash.
The 2 luminosity histograms are about what I would have expected for those shots.
* exposure - amount of light that struck the sensor per unit area while the shutter was open
-
@xpatUSA has written:@DonaldB has written:@xpatUSA has written:@DonaldB has written:@xpatUSA has written:@DonaldB has written:
Quote: A histogram is simply a graphic representation of the exposure levels within an image.
Just levels, Donald, not "exposure levels".
the article i read said exposure levels.
This one? (not a trap)
no but it says the same as this one.
Word for word, interesting, thanks.
Both articles are misleading. Capturetheatlas more because he determines the exposure using LR histogram, not the RAW one.
Artschoolportals article is better but I don't like the way they use PS Levels as example of exposure. -
@DonaldB has written:
Identical exposure settings shutter+apeture+iso
They are not here is a hint for part of the scene you introduced more light thus altering the exposure
-
@IanSForsyth has written:@DonaldB has written:
Identical exposure settings shutter+apeture+iso
They are not here is a hint for part of the scene you introduced more light thus altering the exposure
The exif for the shots shows the aperture, shutter speed and ISO are identical for both shots but the exposure* is not the same as described earlier.
* exposure - amount of light that struck the sensor per unit area while the shutter was open
-
@DonaldB has written:
no but it says the same as this one.
You are misunderstanding what is explained in those articles.
Consider this image with pure red (255,0,0), green (0,255,0) and blue (0,0,255) pixels on a pure white (255,255,255) background.
This is the RGB histogram for the image.
This is the luminosity histogram for the same image.
A histogram of any kind - RGB, Luminosity, whatever - is just a frequency count of some values - RGB, luminosity, the number of various coloured cars crossing an intersection etc etc etc - and nothing more.
-
@IanSForsyth has written:@DonaldB has written:
Identical exposure settings shutter+apeture+iso
They are not here is a hint for part of the scene you introduced more light thus altering the exposure
im not disputing that. have you a better way to show scene luminance ?

