What are you plotting? Raw values? sRGB values? Of pixels? Of averages for entire patches?
The average or mean values in the raw data will separate the patches quite well, even under extreme under-exposure, unless the read noise starts falling below about 0.8DN, at which point the dither of noise will fail to prevent mean shifts in levels as over-quantization shows its artifacts. There are actually very few cameras that do that; it is most common among the last few models that used Sony Exmor 12-bit sensors a decade or more ago, and only at base ISO, as 2x base usually brings those read noise DNs into the safe zone. Some had black frame noise in the 0.4DN to 0.6DN range at base and they can not record even mean patch values accurately. At 2x base, this might be 0.7 to 1.1, which, while not perfect, is much less problematic than base ISO.
With the presentation you gave, and the levels of exposure of even the darkest patches, nothing but conversion style and/or levels editing is going to showing any loss of definition between the first and second darkest patches, or the first and second brightest. They're way out of the range where the sensor and pixels can conflate neighbor patches.
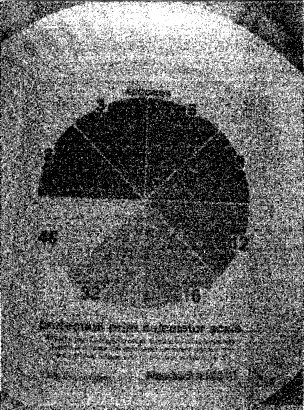
Let me show you how well small pixels can distinguish extremely low-exposure mean patch levels, if the read noise is above 1.3DN. This is the entire frame of a 12-bit, 1.86 micron compact camera, the Canon G9 at ISO 80, under-exposed by about 12+ stops (pushed to about ISO 300,000) , where the brightest, clipped part of the image near the top, above the transparency, is one ADU above the black level, as I clipped away almost 4000 levels. Obviously, there is a lot of image-level noise here, but even the two darkest darkest slices in the transparency are almost distinguishable, and any of the brighter slices, all of which are recorded STOPS BELOW the bottom of the DR:

So, why would there be confusion of levels with much larger pixels, and much more exposure?


