• Members 360 posts
    April 15, 2023, 3:40 p.m.

    Well, like I could not read that before, without any kind of transformation needed. As mentioned in my first evaluation (no offence though, just a remark. I think in binary already, it's a professional deformation).

    That is right. Canons are often little behind. This is EOS M6 II, APS-C sensor. Fortunately, it got better. Some models I owned before were rather atrocious regarding noise performance.. Now one can make do without that much of a sacrifice, and pulling the brightness 2-3 stops in post for shadows is A-OK.

    Quite a bit!

    Well, In a way, I can deduce that the camera is not fiddling with the black point the way Sony often does, otherwise more homogenous data would be inevitable. My post was an exercise or a test, encouraged by that idea to try shoot one dark shot and one fully saturated shot to see the "baselines".
    I expected the saturation to be near 16383, but it was way lower at 15700.

    //And I did take the 600x600 sample little off centre, not in the corners, naturally.

  • Members 1737 posts
    April 15, 2023, 3:47 p.m.

    You said "Three bits rather unusable, drown in the noise". With 3 lSBs or noise, you're really only losing a bit off the ADC. You need about 1 LSB of noise for adequate dither. Before, you were only seeing half the histogram. Base ISO dark field histograms are, in general, asymmetric.

    I've been testing Sonys since their first MILCs, and I've not seen any evidence of messing with the black point, except for using a higher black point at high ISOs, which is not uncommon with other manufacturers.

    The clipping point is manufacturer dependent. I'm not sure what all goes into that decision. I wouldn't call 15700 way lower than 16383. It's 0.06 stops lower.

  • Members 976 posts
    April 15, 2023, 4:11 p.m.

    Maybe we can agree on the dynamic range definition?

  • Foundation 1408 posts
    April 15, 2023, 4:19 p.m.

    I see to recall someone saying that "a picture is worth a thousand words".

    David

  • Members 1737 posts
    April 15, 2023, 4:29 p.m.

    If we're talking EDR with a threshold SNR of 0, it looks to me like it's about log2((15700-512)/3.3) = 12 stops. Not clear on what the difference between bits and stops is in this context.

  • Members 2288 posts
    April 15, 2023, 8:46 p.m.

    thanks for that info Jim. thats good to know from a technical view.

  • Members 1737 posts
    April 15, 2023, 8:57 p.m.

    Iliah is the expert on craw. He reversed engineered the algorithm and published it. Then I took his work and wrote a simulator. This was back in the days when Sony didn't offer uncompressed or losslessly compressed raw. The is -- or at least there used to be, I haven't looked lately -- a tool in RawDIgger that would flag craw-induced errors.

  • Members 2288 posts
    April 15, 2023, 9:11 p.m.

    after running my files through raw digger and the complexity of controls i started to doubt myself and whether using compressed was the right discission can you explain what the 8bits per channel is here ,or is it just the jpeg attached file figure.
    Screenshot 2023-04-16 070900.jpg

    Screenshot 2023-04-16 070900.jpg

    JPG, 143.3 KB, uploaded by DonaldB on April 15, 2023.

  • April 15, 2023, 9:11 p.m.

    That struck me later.

  • Members 1737 posts
    April 15, 2023, 9:45 p.m.

    I don't think you're looking at RawDigger-generated information there. Looks to me like you're looking at the EXIF metadata. RD has a tool that presents that data, but it comes from the EXIF.

    craw uses 8 bits per pixel.

    Here's the algorithm:

    *The data is truncated from 14 to 13 bits.

    The tone curve applied to the 13-bit linear data is a linear interpolation between a curve defined by these input points: 0 1000 1600 2854 4058 8602, and these output points: 0 1000 1300 1613 1763 2047.

    The delta modulation extracts successive groups of 32 pixels within a single row. Because of the RGGB Bayer color filter array, that gives 16 green pixels in all rows, 16 red pixels in the odd rows, and 16 blue pixels in the even rows. Odd and even are defined assuming that the first row is row 1.

    As an example, an odd row would start out RGRGRGRGRG… and an even row would begin GBGBGBGBGB…

    For each group of 16 pixels, the maximum and minimum 11-bit values are found, and the indices of those values recorded as two four-bit numbers. The minimum is subtracted from the maximum to give a number that I call the span.

    Then a value called the step is calculated. If the span is equal to or less than 128, the step is 1. If the span is more than 128 and equal to or less than 256, the step is 2. . If the span is more than 256 and equal to or less than 512, the step is 4. If the span is more than 512 and equal to or less than 1024, the step is 8. Otherwise the step is 16.

    For each of the remaining 14 pixels, the minimum value is subtracted, and the result divided by the step size, truncated (or rounded; that’s what I did) and encoded as a 7-bit number which is stored. Thus we have 16 pixels encoded in 16 bytes (112 + 42 + 7*14, or 128 bits). The algorithm proceeds across all the columns in a row, then moves to the next row down, does it again, until it runs out of rows. That’s what’s in the raw file.

    The process is reversed in the raw converter. The original 11-tone compressed values are recovered by inverting the delta modulation algorithm – I leave that as an exercise for the interested student – and the tone curve is removed by a linear interpolation between a curve defined by these input points: 0 : 0 1000 1300 1613 1763 2047, and these output points: 0 1000 1600 2854 4058 8602.*

    You can just read the part in bold if you don't want the details.

  • Members 976 posts
    April 15, 2023, 10:17 p.m.

    In RawDigger Preferences, Vendor specific, Sony ARW2 section, set "Processing mode" to "Only base pixels". Press "Apply". Next, set it to "Only 'delta' pixels" and press "Apply" again ;)

  • Members 1737 posts
    April 15, 2023, 10:19 p.m.

    Or, if you want, you can wallow in the details:

    [deleted because the site doesn't respect the tabs and without the tabs the code is unreadable.]

  • Members 520 posts
    April 15, 2023, 11:03 p.m.

    The shape is weird here because Canon is molesting the raw data with integer math that causes gaps (it isn't completely raw) The original digitization should have been a nice Gaussian/bell curve.

    The implied peak at 512 means that the nominal black point is 512; the shape is different the first way you showed it because of the logarithmic view and the way the program is re-assigning clipped values (I can't make any sense of that - I would just start the full histogram at -512 and not clip anything, when subtracting the black point).

  • Members 2288 posts
    April 15, 2023, 11:33 p.m.

    Dont you hate that !🤨 so having a studio at my ready access for testing is just amazing . so i put through an image the 1 i linked and set your settings. and went wow look at all the detail missed. took some test shots and i loaded the uncompressed raw and went wow it looks awesome. so back into the studio and took another image in L lossless the loaded it into RD and went wow it looks just like the uncompressed raw file thats awesome. loaded the test image shot in compressed raw and went wow look at the missing detail information. so took both LL and C files into ACR processed and saved as pds file and then compared the both side by side at 1000% and went wow doesnt the L lossless look awesome and more detail. THE BAD news. thinking that faststone would load the images in order . fast stone loaded them backwards and in fact the L lossless was the file that lacked detail an white/grey tones ,compared to compressed file that RD said was lacking information , so now IM really confused.
    Screenshot 2023-04-16 093116.jpg

    Screenshot 2023-04-16 093041.jpg

    Don

    Screenshot 2023-04-16 093116.jpg

    JPG, 570.9 KB, uploaded by DonaldB on April 15, 2023.

    Screenshot 2023-04-16 093041.jpg

    JPG, 136.1 KB, uploaded by DonaldB on April 15, 2023.

  • Members 976 posts
    April 15, 2023, 11:39 p.m.
  • Members 132 posts
    April 16, 2023, 12:39 a.m.

    OK, last try at explaining RAW Histograms (in post processing) and why they matter, as simply as possible..

    This time with pictures and as little techno-speak as possible. Hopefully this will help make some sense of the previous discussion. I walked outside and shot this not so exciting flower for this purpose - no great art here, just an example that will have some relevance to the discussion.

    I exposed this with the most important highlight detail being recorded all the way "to the right" (ETTR), just below clipping. How do we know it's just below clipping/ Read on.

    Here are the initially poor results...

    2023-04-15 16_50_55-New Improved Catalog Oct 15-2-2 - Adobe Photoshop Lightroom Classic - Library.jpg
    2023-04-15 16_48_15-New Improved Catalog Oct 15-2-2 - Adobe Photoshop Lightroom Classic - Library.jpg

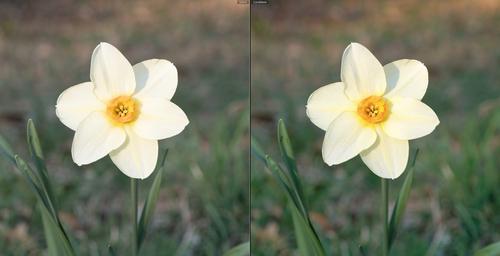
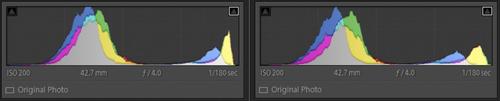
    The RAW file with default Lightroom import processing is on the left, the SOOC jpeg is on the right, with their respective Lightroom histograms below them. Hmm, the Lightroom histograms do not show any highlight clipping for either image yet, though the camera did better, there clearly appears to be a significant loss of highlight detail with both.

    What's going on here? Well, after all the preceding discussion it should have been made clear by now that the histograms we see in our editors (most, but not all editors) are only representative of the images we are looking at on the screen after processing, and does not show what information is present in the RAW file....Hey, wait a minute, I didn't apply any processing, that's just how it opened.. while it’s true that no sliders were moved in the development of that image, if you're looking at an image from a RAW file in your editor, significant processing has already been applied to the RAW file "under the hood" before you ever get to see it and, in this case, it messed some stuff up.

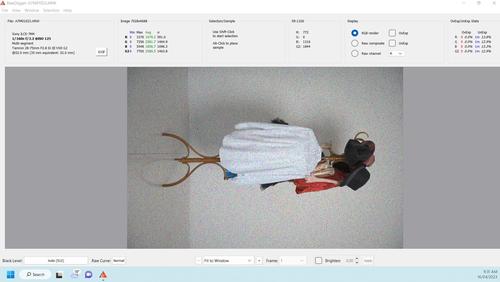
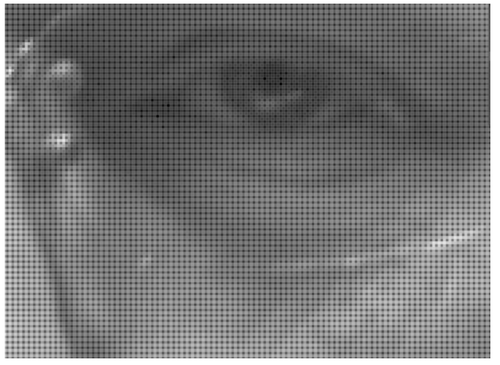
    Let's look at the RAW Histogram for this file (via RawDigger, thanks Iliah) that is representative of the information present in the RAW file...

    2023-04-15 16_15_06-Histogram_ XT2S6465.RAF Full-6032x4028 [ Fujifilm X-T2 f_4.0 1_180 @ISO 200 ].jpg

    As can be gleaned from this, all 3 three channels are intact. the Green channel is maxed out and extends all the way up to, but not significantly into clipping. It's generally considered wise to leave yourself something of a safety buffer, but here we have pretty well maxed-out the exposure for this image. If there was significant highlight clipping present, you would see a spike at the clipping threshold at right side of the histogram (just below 16000). Also, note where the EV 0 line is here (Donald B), for clarity, I moved it from the usual -3 EV to where the clipping threshold actually is (it's really just a handy scale to use as you see fit.)

    So, the if RAW highlight detail wasn't clipped and the exposure was OK, why does the flower look like crap? Because both the in-camera processing and Lighroom's default import processing both got it wrong - usually Lightroom's (and other editors') default import processing is easy enough to work with, but sometimes it really makes a mess of things and you have to work around it (a subject for another thread). A RAW histogram won't fix any of this for you, but it can be a great diagnostic tool for troubleshooting potential exposure problems (as we did here), and can (with some trial and error) be invaluable for dialing in a reliable methodology for making precisely controlled RAW exposures (this example took me exactly one try).

    My exposures are almost always as expected now, so RawDigger isn't something I use regularly, but what a great tool for helping make that previous sentence a reality and, of course, it's especially useful for making sense of any sort of exposure issues.

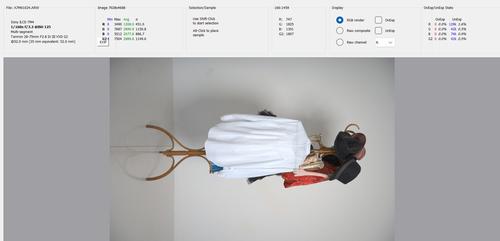
    Here's a before and after with the same RAW file, again with the Lightroom histograms below each one. Note that despite the very significant difference in highlight detail between the two images, the two Lightroom histograms don't look all that dissimilar...

    2023-04-15 20_32_02-New Improved Catalog Oct 15-2-2 - Adobe Photoshop Lightroom Classic - Library.jpg
    2023-04-15 18_09_27-New Improved Catalog Oct 15-2-2 - Adobe Photoshop Lightroom Classic - Library.jpg

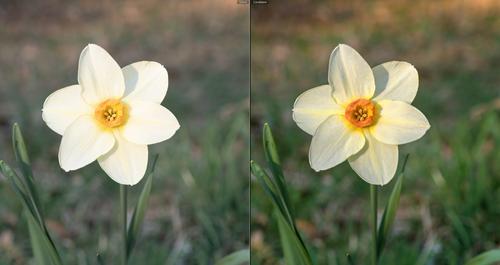
    On the left is the same inexplicably blown RAW default import processing result. On the right is the same file but with different Lightroom development settings ...and how about that, the RAW Histogram was correct, there was viable highlight detail after all (but it's still not an especially good photo).

    I hope some of that made sense.

  • Members 221 posts
    April 16, 2023, 12:39 a.m.

    The raw image file doesn't "look" like anything (except strings of code) until it's been processed into a viewable image. The image you're showing as "raw" is actually a processed image which only needs some minor adjustments to look like a "normal" image.

    There is no such thing as a "raw" image which is viewable, only raw data which can be processed into an actual viewable image.

    For anyone interested in some of the various stages of processing and what the image looks like at different stages, the link below gives some examples...

    Processing RAW Images in MATLAB, Rob Sumner Department of Electrical Engineering, UC Santa Cruz (There are images from various stages of processing in the last few pages of this PDF.)

  • Members 1737 posts
    April 16, 2023, 1 a.m.

    Uh...

    The image data in a raw file is that of a monochromatic one. You can view the image if you extract it from the raw file.

    It looks like this:

    raw image.png

    raw image.png

    PNG, 1.2 MB, uploaded by JimKasson on April 16, 2023.