• WhyNotpanorama_fish_eye
    676 posts
    2 years ago

    I need to share my ignorance .. there is a recent post about a Raw Histogram .. and I'd really like to know what a Raw Histogram would be .. My understanding is that the RAW data is simply a set of photon counts. Histograms are base on color data, usually … Thus, the Raw data has to be converted to some image format – TIFF, JPEG whatever … Even it the histogram is about light gathering across the sensor it seems that some conversion might be required to make that data useful … but then I am sharing my ignorance …. and will read responses with interest ..

    I need a definition for Raw Histogram ….

    WhyNot
  • 1737 posts
    2 years ago

    You don't need to convert the raw data from a capture to an image in order to create a raw histogram. Raw histograms are best thought of as histograms of each plane of an Bayer-CFA sensor, so you don't need to convert the raw data to colors to create a raw histogram.

    As to what's a histogram, here's a look with lots of examples:

    blog.kasson.com/the-last-word/histograms/

  • 2 years ago

    I had the same thoughts as the OP. But what comes out of the camera as a "raw file" has presumably already been converted (with or without compression) from a set of photon counts to something more manageable. Programs like Photoshop and PhotoLab are able to read these files as full images. What, then, is the significance of the histogram displayed for a "raw file" in these two programs?

    David

  • ggbutcherpanorama_fish_eye
    138 posts
    2 years ago

    It shows you the tone distribution of image data before any tone curve is applied. IMHO would probably be better-named "linear histogram". Or, "scene-referred histogram".

    What you're seeing in the camera EVF is a "display-referred histogram", generated from the final image just before display. That image has probably had two tone curves applied, the camera's base curve and the sRGB TRC, so the tone distribution is very different than from that of the raw (linear) image.

    Edit: sorry, missed your assuption:

    No, that's the point of a "raw file", having access to the light values as-recorded, no adornment. Now, that doesn't mean the camera didn't do anything to the raw values before putting them in the file (for instance, my Nikon D7000 raws come "black-subtracted", so not exactly the raw data), but the data should retain the linear relationship of the light measurements.

  • IliahBorgpanorama_fish_eye
    976 posts
    2 years ago

    Raw histogram is of data captured.

    RGB histogram is of data captured and processed (converted to full RGB image) through
    - white balance,
    - demosaicking,
    - colour management,
    - tone curve,
    - noise reduction,
    - sharpening,
    - lens corrections,
    ... etc.

  • 1737 posts
    2 years ago

    What is the raw data in a file except for a set of photon (well, electron) counts? The kind of departures from that are things like hot and dead pixel interpolation, PDAF pixel interpolation, sensor calibration scaling, and the like. But the raw data that's there is "raw enough" for a histogram made from that data to be very useful, probably more useful than data that didn't deal with hot and dead pixels or PDAF pixels.

  • WhyNotpanorama_fish_eye
    676 posts
    2 years ago

    Let me see if I understand this … The histogram from left to right is scaled from 0 to maximum height of the buckets (your term) and the graph represents the number of buckets that have reached that height. And, since each bucket has a red, blue or green filter over it we can separate these to display independently ... Those that have reached the top ( the far right on the graph) are considered as overflowing and the resulting color blown ….

    I can understand this but not sure how that helps or improves my understanding of the resulting image over seeing what the camera believes will be my converted image … My experience is that each post processing software package generates it's own conversion and gives a different histogram based on that conversion.. Not sure how knowing the Raw Histogram, if I have interpreted this correctly, helps me as I look through the viewfinder …. I guess I'm asking about that follow on to your histogram discussion link that you provided ….

  • DeletedRemoved user
    2 years ago

    Sorry, David, that is incorrect. A raw file out of a camera contains unconverted raw data. Some manufacturers mess with the pixel values but they do not convert it to RGB.

    Already answered by Others.

  • 1737 posts
    2 years ago

    The left to right axis is the nominal coded value of each bucket. in hex, 00 is the lowest bucket, and FF is the highest one.

  • 1737 posts
    2 years ago

    At the time of the exposure, the camera can't know how you will process the raw file.

  • WhyNotpanorama_fish_eye
    676 posts
    2 years ago

    Being in a beginners forum .. how does this differ from my interpretation and what is the consequences of that difference . ...

    WhyNot

  • WhyNotpanorama_fish_eye
    676 posts
    2 years ago

    While I can understand how this might be interesting to me as a software developer, I'm still not sure what information I'm reading from the Raw Histogram that effects what I do before I press the shutter ...

    WhyNot

  • IliahBorgpanorama_fish_eye
    976 posts
    2 years ago

    Setting exposure and ISO, knowing what to expect.

  • 1737 posts
    2 years ago

    You have come up with a metric that was not in the blog post: the "height" of the bucket. I don't know what that means. The article talks about the width of the buckets. I was trying to tell you what the x-axis represents without having to understand what you mean by height of the bucket. If you could define that precisely, we could have a different conversation.

  • DeletedRemoved user
    2 years ago

    Might confuse some folks. Sometimes, simplifying stuff for the punters is quite misleading, I reckon.

    An x-axis scaled in Hex is not common- and further the number of "buckets" (more commonly called "bins") varies from app to app and maybe from camera to camera. For example, the histogram that appears on my old Sigma's LCD has nowhere near the common 255 bins, not even close ... 48 mebbe.

  • 1737 posts
    2 years ago

    The camera can't understand how you're going to process the image, so its guess at how it will be processed is of limited utility. What's useful is knowing if the data that the raw developer will have to work with is what it will need to satisfy the photographer's intent for the image.

  • 1737 posts
    2 years ago

    I was talking about the histograms that I used in my blog post, as I was assuming the questioner was. If I'm wrong, I apologize. But it's going to be difficult to talk about histograms in general concisely, since there are so many options.

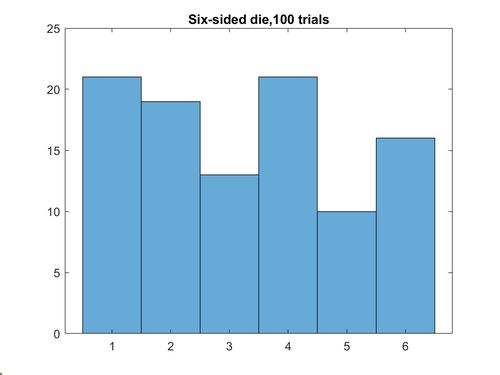
    Maybe it's best to understand histograms before trying to understand image histograms.

    6 sided die 100 trials 2.png

    6 sided die 1e6 trials.png

    6 sided die 1e6 trials.png

    PNG, 27.1 KB, uploaded by JimKasson 2 years ago.

    6 sided die 100 trials 2.png

    PNG, 23.1 KB, uploaded by JimKasson 2 years ago.

  • 1737 posts
    2 years ago

    Lightroom, Photoshop, and the in-camera histograms that I know about use the nominal coded values in some defined color space for the x-axis.