Donald,
I have no idea what that means. Can you explain?
Alan
Donald,
I have no idea what that means. Can you explain?
Alan
tell me does NR increase dynamic range 🤔

Obviously, but see dougkerr.net/Pumpkin/articles/ISO_Dynamic_range.pdf

First you have to tell me why you think this is a high dynamic range image.
I feel many of us will know your answer and we can keep going around in circles until you understand what determines the limit of DR
It can depend on what the manufacture has decided on how iso is implemented
www.rawdigger.com/howtouse/the-riddle-of-intermediate-iso-setting
I have fast forwarded the a point in the video with a camera that has similar response to your above graph
youtu.be/YkaTzq3ZVz0?t=184

LOL! Excellent.
If I understand correctly then the ISO 160 and 250 data is just the ISO 200 exposure shifted by 1/3 stop either way to change the brightness, or something very similar. The graph is just showing the shift in the data set.
In my earlier response I don't dismiss the maths as a way of discovering the correct answer, as in this case it gives the correct one, just that looking at the graph alone we can make too many base assumptions that are then "difficult to shift" from our thinking. For instance if we look at the graphs we see a difference in noise then we look for reasons to explain a difference in noise without really challenging the base assumption that the noise has changed. If we looked at the photos then we would possibly see that there was no difference whatsoever in the two images other than brightness and possibly look for an explanation that showed how the data in the graph was being manipulated. Being that the end result of photography is to view with the human eye then the assumption is that cameras are programmed to make visual sense and so that's what you see in the data rather than a consistency with our understanding of maths.
Donald, one more insult likethis to other members and you will get a 7 day ban. If you can't be civil, then you don't belong here. As it is, that post has been moved.
Alan
how about you just delete my membership now, im getting tired of all the bashing and my posts being manipulated and deleted charts, im over it.
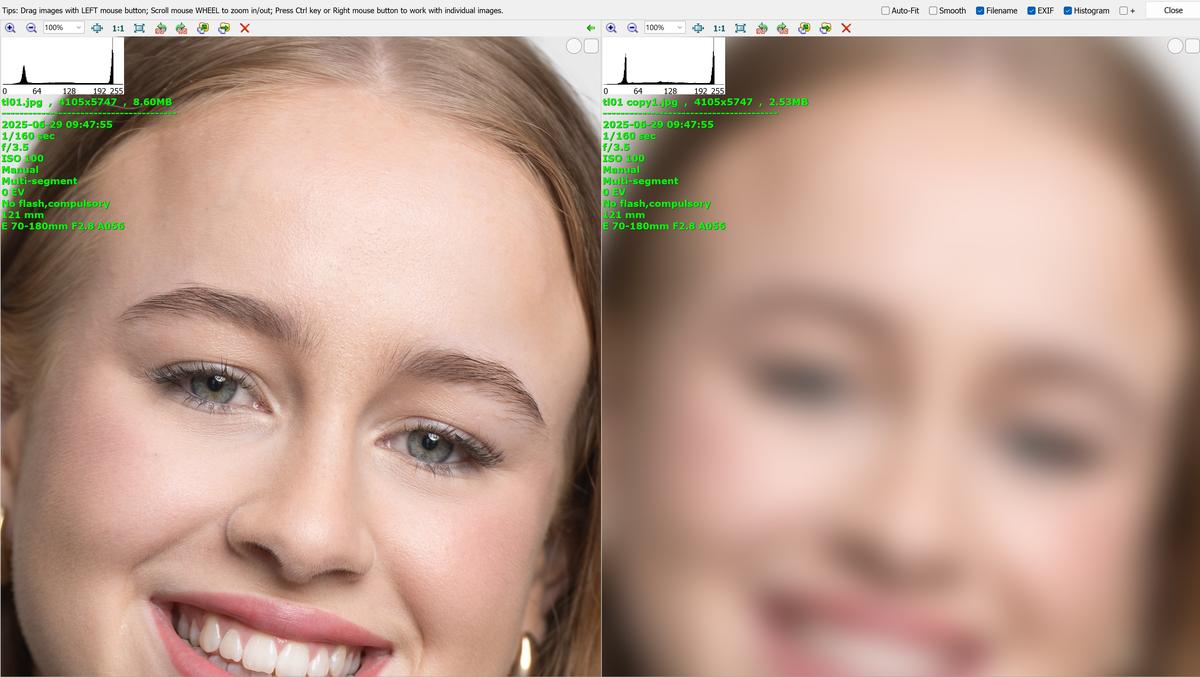
this clearly shows the near clipped skin tones that you conveniently deleted from my post.
I'm not confident that there is a way to explain this to the layman without the nitty-gritty of all the math and hardware and manufacturer choices in processing raw data. A simple analogy that could work would be audible hiss in an audio tape recorder, where you recorded with levels that were too high or too low, and you tried to fix them after they were mixed with the hiss. If the mic levels were too high, you might reduce the gain as you play back the recording, and you will make the hiss a little quieter. If the mic levels were too low, you might boost the levels as you play back the recording, boosting the level of the hiss. The component of noise called "Post-gain read noise" is analogous to hiss.
Regarding the raw data itself, these deviations away from a simple consistent PDR trend are the results of pushing and pulling select ISOs with math or pushing with a late-stage amplifier at the ADC. Many cameras do not have unique analog gain for every 1/3-stop ISO setting, and are forced into inconsistency. For a camera like the Canon 5D3, we get something like this:
                                    Post-gain
 ISO  Analog gain   Headroom       read noise         DR
  50          100    -1 stop          -1 stop
 100          100
 125          100                   +1/3 stop  -1/3 stop
 160          200  -1/3 stop        -1/3 stop
 200          200
 250          200                   +1/3 stop  -1/3 stop
 320          400  -1/3 stop        -1/3 stop
This inconsistency has no effect on photon noise or the pre-gain read noise, but it does directly drive the post-gain read noise up and down along with the pushes and the pulls, and can lose headroom, too, relative to metered middle grey for the ISO setting. At high ISOs, the post-gain read noise is very small compared to the photon noise and the pre-gain read noise, so pushing and pulling change the total noise level variation much less, but at low ISOs, post-gain read noise is the dominant noise in deep shadows. Since DR is limited on the bottom end by noise, pushes increase noise without increasing headroom (because of bit-depth clipping). Pulls will lower the post-gain noise, but also pull down the clipping point, too, so the person's 5D3 is probably losing 1/3 stop of DR at ISOs 125 and 250, but isn't gaining any at ISOs 160 and 320. This all assumes that the manufacturer is not using a clipping point below that of the original raw data readout. Bill's PDR does not look at exact clipping levels, so expect up to 1/3 stop of missing PDR with cameras that pull some of their ISOs by 1/3 stop. He just assumes that 16383 is the highest raw value used, in a 14-bit raw, which is sometimes not the case, such as when the ISOs are pulled.
So, for what "PDR" is intended to be, which is DR by Bill's standard, the PDR boosts at ISOs 160 and 320 are not really there. However, if you use PDR for what it was not intended, a noise metric, then it just happens to be accidentally significant, and images will have deep shadow noise that is lower at ISOs 160 and 320 on a camera like the 5D3.
The 60MP Sony FF cameras are a little bit noisier than the lower-MP Sony FF cameras, but based on your previous statements, I have no confidence that you are comparing equitably, because you are allowing pixel-level noise vs sharpness to shape your assessment.
That isn't correct, though. All sensors can record and distinguish light levels well below the bottom of DR. DR is a matter of enumeration of aesthetics, where the "bottom" of DR typically represents the tonal level where noise is not above a selected standard.
If a camera is actually used to image near or below the "noise floor", the enumerations that we usually see are not very precise, because the read noise character varies quite a bit across cameras, with some being very random, like the roll of a die for each pixel, and some having strong banding and blotching, driving color images into areas of green-tinted and magenta-tinted zones of blotches.
No; DCG is two different capacitance levels for the photosites, which gives two different full-well capacities. It mainly means more headroom at base ISO, without non-linear response that makes color errors in raw highlights at base ISO. Of the 4 major noise sources, only one, pre-gain read noise, is affected by dual conversion gain, with the lower ISOs giving more of it, as measured in electrons.
great example of proving that using a noise filter decreases DR not increases it like bills charts would make you beleive. 😊never used Dolby for that reason.
Which Dolby algorithm are you referring to: A, B, or C?
All that data shows it's distribution in a color space and has nothing to do with exposure


Here we have 2 histograms showing just as I described the distribution within a color space.
The question to you is which histogram is the correct one showing how close the image is to clipping?
They surely cannot be both correct or maybe they both are


Or here where I have selected the same color but with different values how can this be ?
Alan,
PM sent to you re: "one more insult".
Ted,
I saw it - you don't have to remind me.
Alan
OK - was just making sure, sorry ...